EUR/JPY Gradually Drifts Lower as Long-Term Dynamics Remain Intact

If we combine the relative strength of the euro with the structural weakness of the Japanese yen, we identify the FX cross in which the currency of the Land of the Rising Sun has depreciated the most against one of the three major global currencies.
The primary driver, among the various macroeconomic factors influencing a currency, has been interest rate expectations. The US dollar experienced a challenging year, being well into its easing cycle since late 2024 (September). What may come as a surprise (and indeed did surprise the author of this report) is that its year-to-date performance against the yen was negative. USD/JPY declined by 0.41%, falling by 65 pips to close at 156.71 as of 31 December 2025.
This outcome also reflects recent developments in Japan, where inflation, both consumer price and wage growth, has finally reaccelerated. At an annual rate of 2.9%, Japanese inflation is currently second only to that of the UK (3.2%). As is well known, this has contributed to a narrowing of interest rate differentials versus other major economies. The Bank of Japan has pushed monetary policy to its highest level in 30 years (0.75%), while the 10-year JGB yield rose yesterday to 2.124%. This remains, however, well below comparable benchmarks such as the German 10-year Bund at 2.818% and the US Treasury at 4.136%.
In any case, as noted at the outset and without delving into the specifics of the different economic blocs, EUR/JPY was the top-performing cross in 2025, gaining 12.77% (from 162.75 to 184.01), outperforming even GBP/JPY, which rose 7.24% (from 196.80 to 211.23). We therefore turn to an assessment of its current technical configuration.
TECHNICAL ANALYSIS
The new bullish impulse that characterized 2025 began in February, specifically on the final trading day of the month, from a level of 154.74. On a higher timeframe, the long-term trend can be traced back to May 2020, originating from the 114 area. This is noteworthy, as it underscores how certain fundamental dynamics can remain resilient over time, despite short-term disruptions.
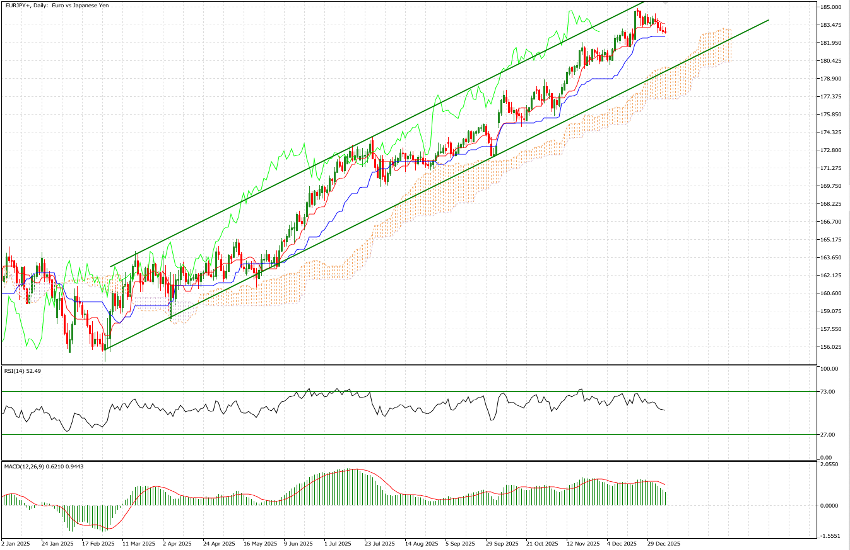
Price action over the past year has been exceptionally orderly, unfolding within a well-defined channel in which at least five waves can be identified, consistent with classical Dow Theory. From March onward, the RSI has remained broadly in positive territory, dipping below 46 only briefly in September; a similar pattern was observed in the MACD. In today’s chart, instead of employing the usual moving averages (21, 50, 100), we present the Ichimoku indicator, which is itself a moving-average-based framework, albeit calculated differently. Here as well, price has consistently remained above both the slower average (Kijun-sen), and on the few occasions when it briefly dipped below it, it found clear support within the cloud (the area highlighted in orange).
As of today, EUR/JPY is trading at 182.92. The RSI is once again drifting lower toward the 50 level (currently at 52.79), and price is trading between the fast average (Tenkan-sen) and the slower one. Given that the cross has been consolidating since 19 December (the date of the latest BoJ decision), we focus on key support areas. The first support lies at 182.58, followed by a more critical level at 180.15, which marked the mid-November floor and where, should price reach it, it would likely encounter the upper boundary of the Ichimoku cloud. In between, the 181.70–182.00 area should not be overlooked.
That said, we do not yet see a structural shift in the longer-term dynamics of the yen against other currencies. As such, we believe a sustained and meaningful appreciation of the yen remains unlikely, and positioning aggressively in its favor continues to carry elevated risk.