Small-Cap Index US2000 Edges Toward Highs

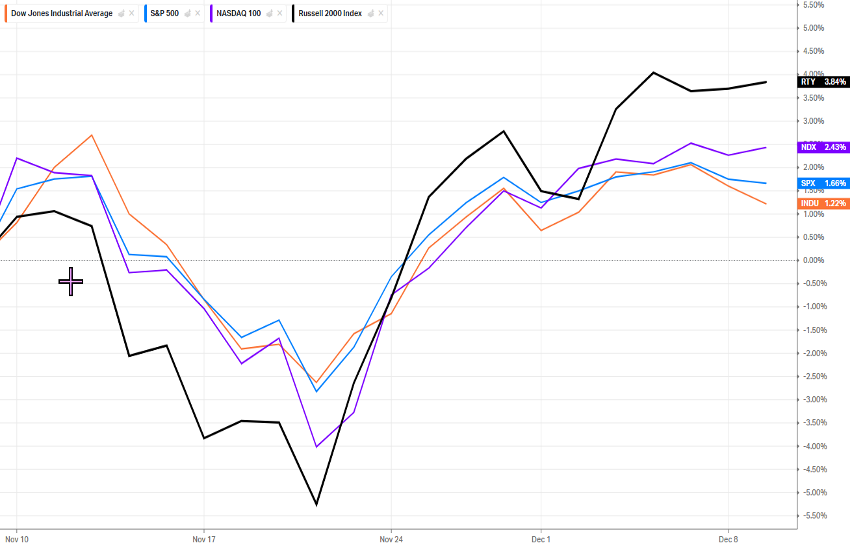
While mega-cap tech companies continue to deploy extraordinary levels of capital into data-center infrastructure—this morning’s headlines note that both Amazon and Microsoft will invest billions in India, USD 35bn and 17.5bn respectively—the standout in yesterday’s U.S. session was the Russell 2000. It was the only among the most-traded U.S. equity indices to register new all-time intraday highs during New York cash trading (to be precise, it slightly exceeded this level on October 15 during continuous trading).
For those less familiar with it, the Russell 2000—or US2000—tracks small- and mid-capitalization companies. The smallest constituents have market caps just above USD 100 million, with the median near USD 1 billion, although several names exceed USD 20 billion. More technically, it is the “younger sibling” of the US1000; companies that become too large are shifted there during the June reconstitution.
This evening, as well known to anyone following financial markets, the Federal Reserve is expected to cut its benchmark rate by 25 bps. Whether this will be the “hawkish cut” that some well-informed observers have begun to anticipate is beyond the scope of this note. What matters here is that smaller companies—typically more dependent on external financing than the mega-caps—stand to benefit disproportionately from a lower cost of capital. Indeed, the US2000 has been the top performer among major indices over the past month (+3.84%), more than tripling the return of the Dow Jones Industrial Average.
Technical Analysis
Today we focus on a slightly lower timeframe than usual—though not excessively so: the 4-hour chart. The 2,545 area marks the absolute all-time highs and therefore serves as a key reference point. If this level is broken to the upside—likely not before the central bank decision—it would open the way to uncharted territory. Typically, however, breakouts are followed by a retest to confirm that price can sustain itself above the level.
To the downside, several static support levels stand out: 2,514, 2,465, 2,424, 2,375, and the more significant 2,332 (not visible in this chart, but decisively tested in August). Note that the range between the highest and lowest referenced levels spans 8.3%, making it unlikely for such a move to unfold in a single day—or even within a week—given the 4-hour timeframe.
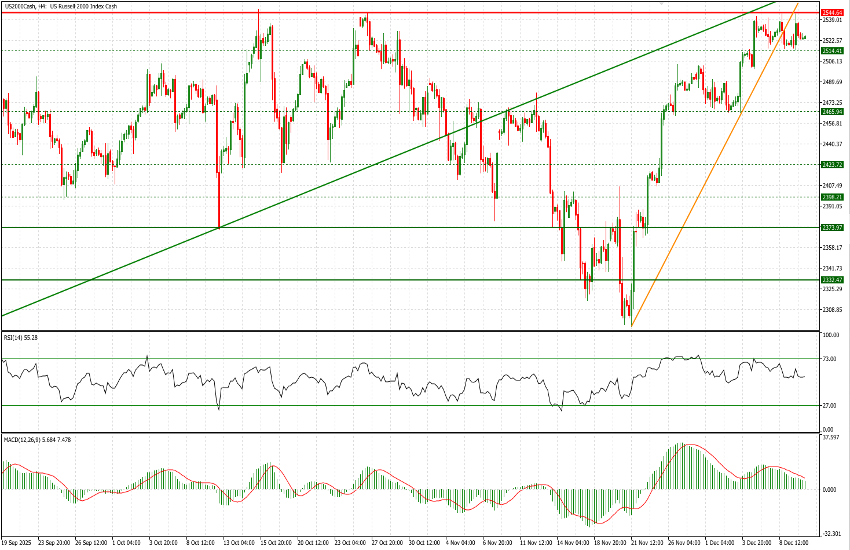
We also observe that both the green trendline (originating in April 2025) and the steep orange trendline (capturing the recent rally) have been broken, indicating that price is finding it increasingly difficult to maintain the prior pace of ascent.
For intraday context, here are today’s daily Pivot Points (the indicator was omitted from the screenshot for clarity):
- R2: 2,557
- R1: 2,541.8
- PP: 2,528
- S1: 2,512.9
- S2: 2,499.4
One final note: after the rate announcement—and especially once Powell’s press conference begins—expect rapid and volatile price swings that may fade quickly. Adjust your exposure accordingly.