S&P 500 Following Weak NFP and Retail Sales Data

As of yesterday’s close, the S&P 500 is up 15.62% year to date. This performance is broadly consistent with the long-standing assumption that, over the long run, the index that best “represents” the market tends to deliver average annual returns of around 10%. This may help explain why, for several weeks now, we have no longer seen a new all-time high on a daily basis, and why sessions with meaningful pullbacks have alternated with positive trading days.
The intraday cash-session high was reached on October 29 at 6,920.34, and this level has so far held. Last week, the market made another attempt to challenge it, but prices were rejected once again after reaching 6,903.46.
At the same time, there are increasing signs of a slowdown in the US economy. Most recently, retail sales data disappointed, coming in flat despite expectations for a marginal increase. More importantly, the labor market appears to be losing momentum: the October Non-Farm Payrolls report—released yesterday alongside the November data on an exceptional basis—recorded the sharpest decline since 2021, with a loss of 105,000 jobs. This pushed the unemployment rate up to 4.6% from the previous 4.4%. Notably, over the past six months, positive employment figures have alternated with data showing job losses, a pattern not seen for four years, during which the US labor market had been expanding consistently.
TECHNICAL ANALYSIS
As discussed approximately one month ago, the upward channel in which the index had been trading since early May was broken on November 18 at 6,652, a few days after prices fell below the 50-day moving average. In that instance, after three sessions, the index found support at the 100-day moving average, having also tested the 6,500 level. This area now represents a key support zone; it also marked the low of the sharp sell-off triggered on Friday, October 10, by statements from President Trump—later revealed to be partially accurate—regarding a potential tightening of trade relations with China.
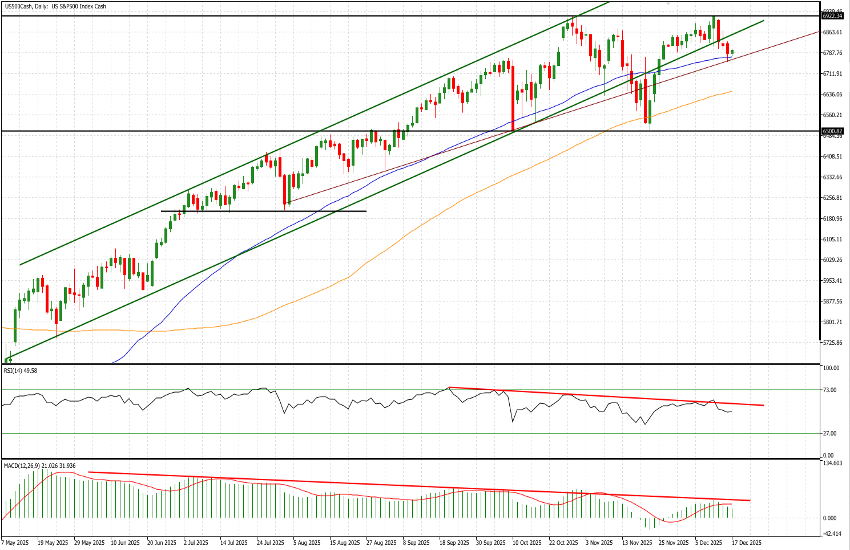
Subsequently, the index briefly recovered the channel and moved back to test the highs, from which it was once again rejected. The US500 is now trading below the channel. Before shifting to the 30-minute timeframe, it is worth highlighting that the 50-day moving average is once again acting as support, currently around 6,771, as well as the brown trendline, which for now represents a very tentative hypothesis of a new, lower-slope price trend.
On the 30-minute chart, a clearly defined descending trendline is being tested at the time of writing. The market’s reaction at this level will be critical for near-term price action. Even a potential upside break would require confirmation through a move to, and above, 6,825—the base of the purple rectangle that marks a significant support area from previous weeks. The RSI is showing a mild bullish divergence.
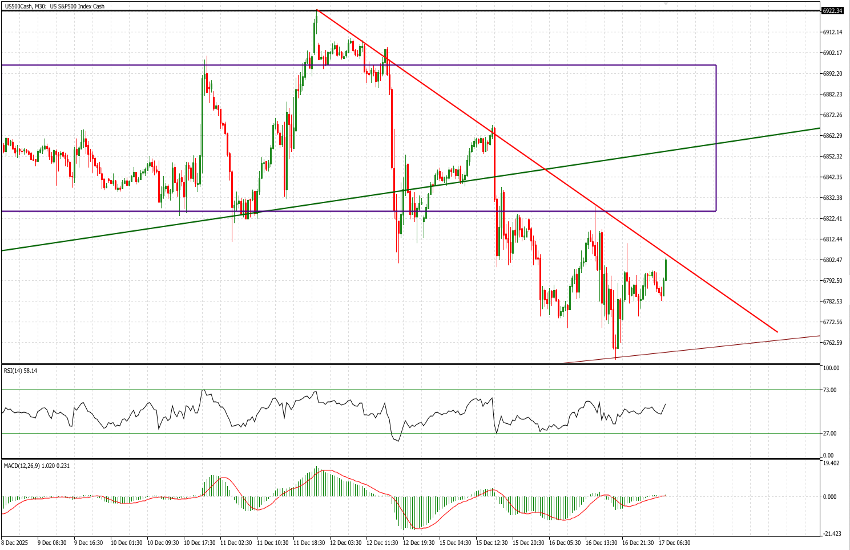
Overall, the author’s bias remains slightly negative. A test of 6,782 would not be surprising, followed by potential moves toward 6,774 and then 6,760. Given that the two reference levels cited—6,825 and 6,760—correspond to deviations of approximately 0.3% and 0.6% from current prices, a broader end-of-day move cannot be ruled out; however, this would require a clear break of these key levels.