How Far Can Silver Go?

Just over a month ago, we focused our attention on silver (here), highlighting its growth potential when it was still trading around $53. In particular, we emphasized the metal’s structural production deficit: for several years now, global demand has consistently exceeded actual supply.
This naturally raises the question of what has driven such a sharp—and seemingly sudden—acceleration. In fewer than 40 trading sessions, from the open on November 18 at $49.90 to this morning’s price of approximately $84, silver has appreciated by 68%. These are figures more commonly associated with so-called “meme stocks” than with a metal that is fundamental to a wide range of industrial applications and which, throughout much of human history, was considered even more valuable than gold.
While references to meme stocks inevitably recall the episode from a few years ago when the so-called “Reddit Army,” after exerting pressure on small-capitalization equities such as AMD or Hertz, attempted to do the same with silver, that dynamic is not relevant in the current context. The present price action is being driven by a forceful increase in both current and expected demand, which has materially increased volatility. This has prompted the CME (Chicago Mercantile Exchange) to raise margin requirements twice within a few days for the March 2026 silver futures contract, increasing them from USD 20,000 to USD 25,000 toward the end of December.
Once again, the underlying catalyst behind this surge in expected demand is artificial intelligence, particularly through its impact on the construction and expansion of data centers.
Silver plays a critical role in data centers due to its superior electrical and thermal conductivity. The metal is essential in power infrastructure—including switchgear, relays, circuit breakers, and silver-plated copper connectors—where it reduces resistance and prevents overheating in high-voltage systems. Silver is also used in server circuit boards, where silver-based inks create conductive pathways, and in thermal management systems, where its industry-leading thermal conductivity (429 W/m·K, 7% better than copper) helps dissipate the extreme heat generated by AI processors. In high-performance computing chips like GPUs and TPUs, silver is used for internal connections, packaging, and semiconductors. A large hyperscale data center can require several thousand ounces of silver across its infrastructure, making the technology sector’s rapid expansion—particularly in AI—a significant driver of silver demand.
TECHNICAL ANALYSIS
Silver is trading at all-time highs, and the price action has clearly entered a parabolic phase. As of this morning, the rally has extended by an additional +5.58%, reaching $84.36. For traders, there are two key considerations at this juncture. First, virtually all conventional technical patterns have been invalidated; momentum and so-called “animal spirits” are currently dominating price dynamics. Second, volatility is so elevated that even correctly anticipating the end-of-day direction exposes traders to a high risk of being stopped out intraday due to sharp and violent price swings.

As a result, this should presently be considered an extremely high-risk trade when executed on margin. It may, however, remain useful and potentially profitable for short-term scalpers—participants aiming to capture small price increments around breakouts or the testing of specific technical levels.
Starting with the daily timeframe, we have selected a 5-day ATR to capture the most recent volatility regime. This indicates that, over the past week, average daily price ranges have fluctuated between approximately USD 5.15 and $7.45 (based on a rolling average). This is a critical parameter that must be kept in mind. Notwithstanding this volatility surge, the price has not even pierced the Bollinger Bands, which suggests that, from a purely technical standpoint, the move can still be interpreted as structurally “healthy.”
Shifting to the 30-minute chart and resetting the ATR to 22 periods, we observe that the average price movement per half hour has been around $0.67, equivalent to roughly 0.85% when using an average price of $80. RSI and MACD are elevated but only marginally overbought and, importantly, do not yet display any divergence.
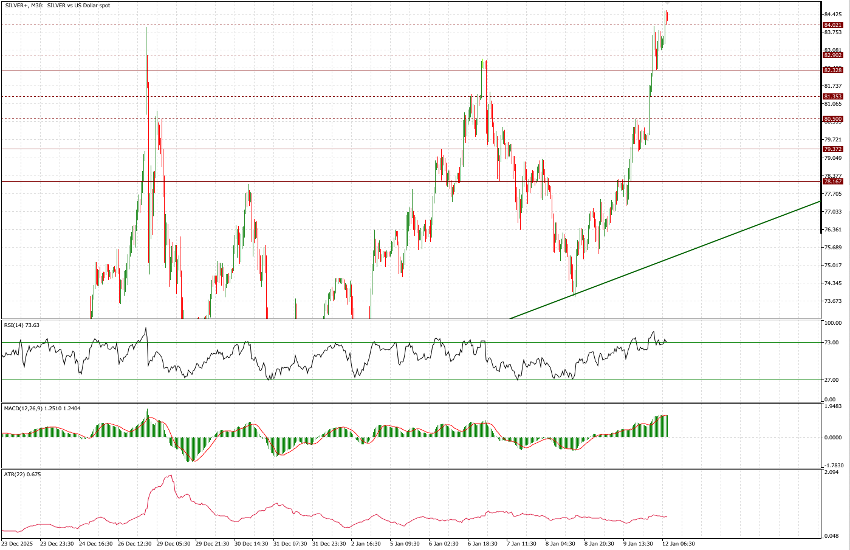
Several support levels have been highlighted on the chart, marked with dashed or solid lines depending on their relative significance. Particular attention should be paid to $84.00, $82.90, $82.30 (+), $81.35, $80.50, $79.37 (+), and $78.15 (+). To the upside, price discovery is occurring in largely uncharted territory, a context in which it is generally advisable to let long positions run while closing any short exposure immediately.