WTI Remains Weak Despite the Latest OPEC+ Decision

Over the past weekend, OPEC+—the world’s leading oil-producing coalition comprising eight countries including Saudi Arabia and Russia and accounting for roughly one-third of global crude output—announced a voluntary pause to the production increases originally planned for the next three months. The initial proposal envisaged adding 1.65 million barrels per day to its current output of around 33 million bpd, effectively unwinding the cuts implemented in April and November 2023. However, current market dynamics on both the supply and demand sides appear to advise against such a move.
The market is currently oversupplied, with global demand estimated at approximately 106 million bpd while production stands closer to 107.5 million bpd. In recent years, countries such as the United States have further improved extraction techniques, particularly in shale production, pushing U.S. output to a record level in September. Many wells remain profitable even with prices around $60 per barrel. Other producers, including Brazil, Canada, and Norway, have also increased output as long-standing investment projects begin to bear fruit.
On the demand side, growth remains sluggish. In Europe—and more broadly across OECD countries—green policies and the rising adoption of electric vehicles are beginning to weigh modestly on oil consumption. Transportation accounts for 55% to 65% of total demand, followed by roughly 30% from industrial use and petrochemicals.
The combined effect of these factors has kept crude prices under persistent downward pressure.
Technical Analysis
On April 4th of this year, WTI crude broke below the key $66 support level. Aside from a brief rally in June—when prices climbed to $78.80 for less than two weeks—WTI has consistently traded below this threshold. The $66 zone had been tested multiple times in 2024 and had held since 2021, making its breach particularly significant. The $62 area also carries technical relevance, and prices have reacted to this level several times in recent months.
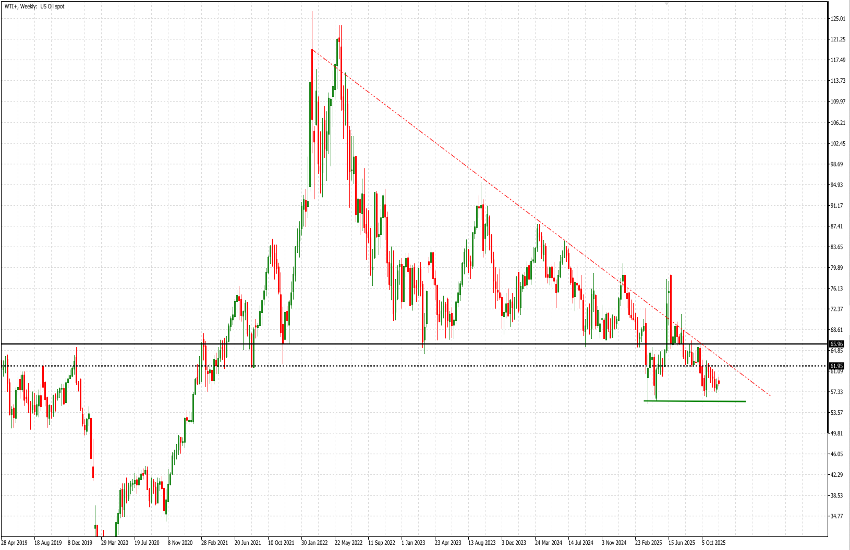
The long-term trend remains unequivocally bearish. Nevertheless, in recent months the market has avoided new lows, and traders appear to be identifying an additional layer of support around $56—a level tested three times this year. Yesterday’s close came in at $58.65, while volatility, as measured by ATR(14), is historically subdued with an average daily range of $1.41. The MACD remains negative, as do the 50-day and 200-day moving averages ($60.17 and $63.77 respectively). The long-term trendline currently sits near $64.55.
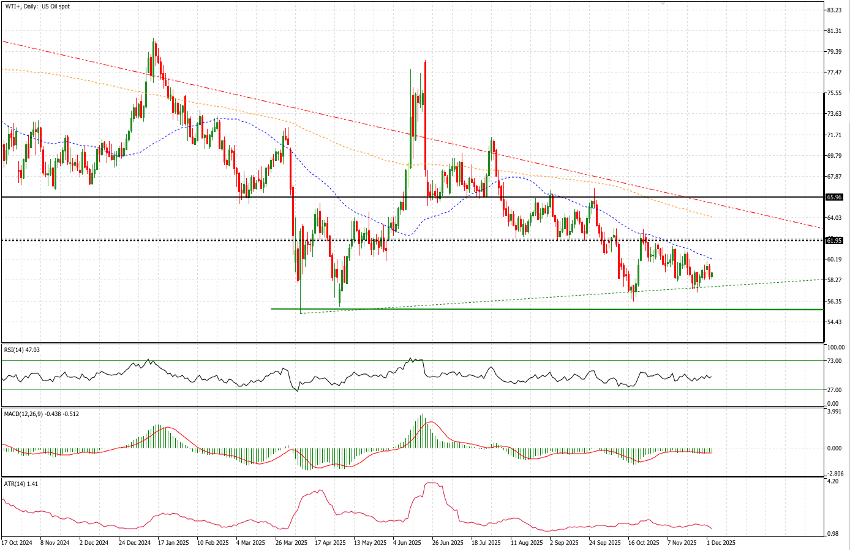
In short, price action over the past month has been anything but aggressive. In the short to medium term, traders can rely on the well-defined support zones forming—most notably the $56 area (retested on October 20th) and the $57.10–$57.50 region, which also shows a pattern of higher relative lows and lies closer to current levels. The prevailing oversupply and lackluster demand outlook provide little fundamental justification for an imminent rebound, though—as history often demonstrates—a geopolitical shock could quickly alter the balance.
