Euro Stoxx 50 Set to Close a Strong Year Despite Europe’s Woes

At yesterday’s close, following a solid session that saw the index rise by 1.06%, the Euro Stoxx 50 (EU50Cash) is up 17.92% year to date in euro terms. This represents a strong performance; however, it should be noted that a substantial portion of the gains was concentrated in the first two months of the year, when the index advanced by approximately 14% between January and February. That rally was largely driven by expectations surrounding Germany’s ambitious economic plan focused on infrastructure and defense spending.
Subsequently, trade tariff tensions triggered a sharp correction. More recently, however, optimism has returned, supported in part by the anticipated disbursements under the Recovery and Resilience Facility, which have improved sentiment toward the outlook for European corporates.
The index comprises 50 of the largest companies by market capitalization across the continent, and as such its performance is closely tied to macroeconomic developments not only in Germany, but also in France, Italy, and Spain—particularly the former two, which are often viewed as the region’s main economic laggards, albeit for different reasons.
That said, the resilience of several heavyweight constituents—such as ASML (semiconductors), SAP, LVMH (luxury goods), and Sanofi—has underpinned an overall performance that can be considered more than respectable.
Finally, at yesterday’s meeting, the European Central Bank kept interest rates unchanged and revised upward its growth forecasts for the euro area, projecting GDP growth of 1.4% for the current year, and 1.2% and 1.4% for 2026 and 2027, respectively (up from previous estimates of 1.0% and 1.3%).
TECHNICAL ANALYSIS
On the daily chart, the initial rally recorded in the first two months of the year is clearly visible, with the index advancing from approximately 4,850 to 5,540, followed by a consolidation phase lasting until April. This was then interrupted by the customary sell-off and a subsequent sharp rebound triggered by the announcement of the so-called “trade war.” Notably, the Euro Stoxx 50 rebounded very quickly and then moved into a sideways trading range, broadly between 5,250 and 5,450.
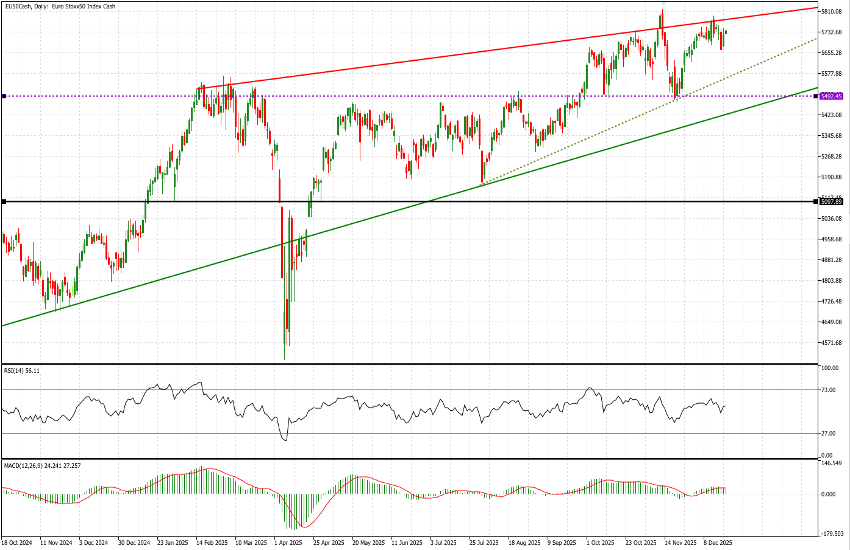
The solid green trendline represents the long-term uptrend originating in September 2022. The upper red line connects this year’s highs, while the dashed green line attempts to better structure the upward move that ultimately led to the breakout from the May–September consolidation range. Considering that price action typically oscillates between the upper and lower boundaries of a trend channel, the next natural phase would likely be either sideways or mildly corrective.
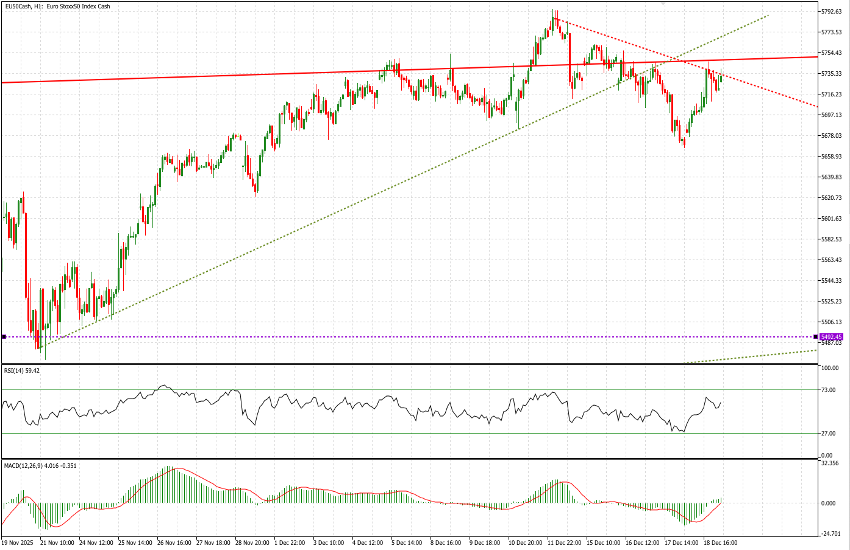
Shifting to the 1-hour chart, we observe a further pause in the upward momentum that began in mid-November, with prices clearly stalling around the 5,750 area (most recent high at 5,795, slightly below the previous peak at 5,817). On the supportive side, both RSI and MACD on the 1-hour timeframe are trending higher.
That said, this session represents one of the last active trading days of the year. Moreover, today is quadruple witching day—when index and equity options and futures expire simultaneously—with significant open interest set to roll off. As a result, it is fair to assume that market dynamics for the next two weeks will largely reflect positions already established.