USD/JPY Slides Sharply on Rate-Check Rumors

In recent years, it has happened on several occasions that Japanese monetary and government authorities (often in coordination with their counterparts) begin to express concern when USD/JPY moves above the 150 level and step into the FX market to stabilize the domestic currency as it approaches the 160 area. The first intervention took place in October 2022, followed by episodes in July 2024 and January 2025; in all cases, these actions were followed by a meaningful appreciation of the yen in the subsequent weeks.
Late on Friday afternoon in Europe—after 11:00 a.m. New York time, when market liquidity typically starts to thin—USD/JPY was aggressively sold, falling from 158.15 to 156.35 in less than an hour, before extending lower. Market chatter intensified, even though the move was denied overnight by Finance Minister Katayama. According to the prevailing rumor, Japanese authorities requested the Federal Reserve’s trading desk to conduct a “rate check,” i.e., to assess interbank liquidity conditions in preparation for a potential FX market operation. Japan and the United States typically coordinate on such actions, with the Fed tasked with buying JPY during U.S. trading hours—incidentally, the same window in which previous interventions were executed.
While no actual intervention has taken place so far, this move could be a precursor to one. In the meantime, USD/JPY has declined by a further 1.06% overnight, bringing total losses over a few hours to approximately 3.25%—an exceptionally large move for this currency pair.
It is well understood that yen weakness is a concern not only for the Japanese government but also for international counterparts. As recently as last week, U.S. Treasury Secretary Bessent highlighted his concerns on the matter, also referencing the weakness of the Korean won, among others. There may therefore be an element of international political coordination behind this development. In any case, the move is highly significant, particularly given the spillover effects it tends to have on equity markets—a topic we will address in tomorrow’s post when analyzing the S&P 500.
TECHNICAL ANALYSIS
We begin with a weekly chart highlighting the three previously mentioned intervention episodes. As shown, the first intervention occurred at lower levels, when the pair peaked around 151, whereas in subsequent instances authorities allowed USD/JPY to extend much further, up to or close to the 160 area. This year, the pair reached 159.50 just two weeks ago and is currently trading around 153.95.
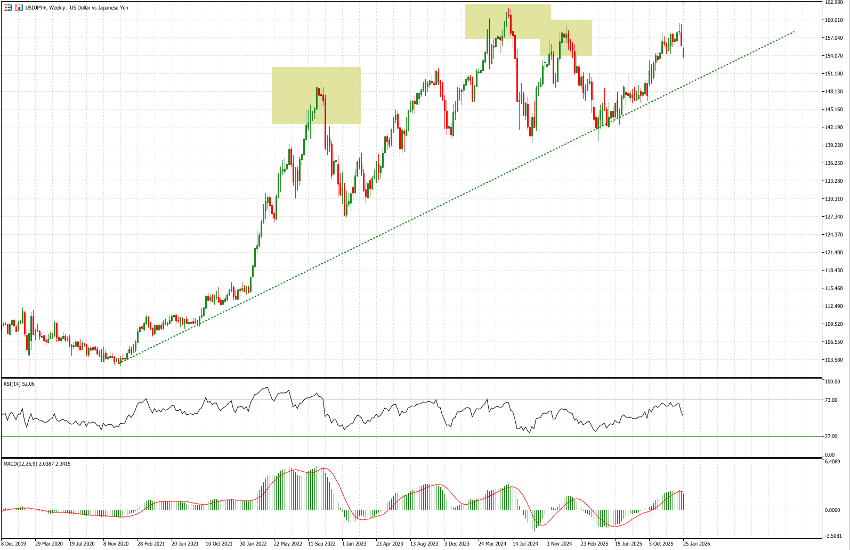
We have also drawn a long-term trendline originating from the 2020 lows. This trendline fits remarkably well and could provide a potential downside target for the current move. That said, we prefer to treat it with caution and regard it as a relatively weak technical indication rather than a high-conviction target.
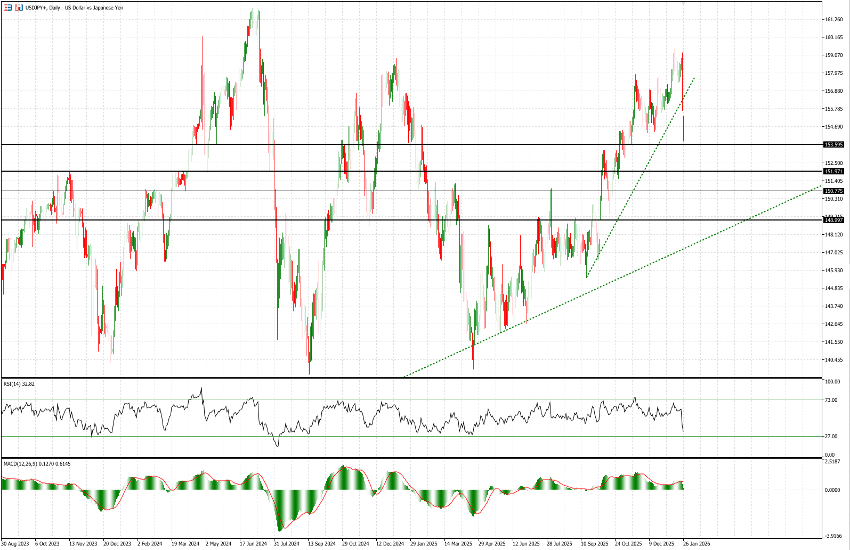
Turning to the daily chart, there are several downside static levels worth monitoring. The most relevant are around 152 and, further below, the 149 area—where the aforementioned long-term bullish weekly trendline would also come into play. The shorter-term uptrend that began in September has been broken over the course of just two sessions.
There are also less robust static levels (often referred to as supports) that merit attention, such as the 153.60 area—very close to current price levels—and another more significant zone around 150.75. These are areas where the decline could temporarily slow, consolidate, or even reverse in the short term.
What is clear is that moves of this magnitude typically generate elevated volatility across JPY pairs and crosses. In this instance, the market participants involved appear to be large, influential players capable of driving price action almost at will. As such, positioning against the move warrants a high degree of caution.
