Nasdaq Briefly Turns Negative for the Year as Tech Weigh

At one point yesterday, the Nasdaq (US100) was down as much as 2.3%, pushing the tech-heavy index into negative territory for the year. The intraday low was 25,112, compared with the 31 December 2025 close of 25,249, implying a year-to-date decline of 0.54%. The index later rebounded to 25,338 before closing the session down 1.55%.
Most technology stocks finished in the red, including several members of the “Magnificent Seven” that have reported earnings so far. Microsoft, Meta Platforms, and Tesla fell by approximately 3%, 2%, and 1%, respectively. Nvidia also declined sharply, down 2.84% on the day, extending its year-to-date loss to 3.3%.
Software stocks were the hardest hit. Salesforce and ServiceNow both dropped around 7%, while Intuit plunged 11% and is now down roughly 30% year to date. Palantir gave back about 5% of its intraday gains after surging earlier in the session following its earnings release, although it still closed firmly in positive territory.
Weakness in the software sector has carried over into Asian markets this morning. Japan’s Micro Services is down around 8%, while India’s Tata Consultancy Services and Infosys are both lower by approximately 6%.
The largest ETF tracking the software sector (IGV) is down 17% since the start of the year. This drawdown reflects growing investor concern that artificial intelligence could disrupt the sector’s long-standing growth model. Software companies—long valued for sticky subscriptions and predictable renewals—are now facing increased scrutiny as AI tools promise to automate workflows, compress pricing, and lower barriers to entry for new competitors.
Technical Analysis
Below is a four-hour chart of the US100 starting from 10 December of last year. The two light-blue ascending lines mark the lower boundary of a daily uptrend channel that has been in place since May last year. The dark-green support at 24,625 represents a critical floor, which has held consistently since September, aside from two brief breakdowns that were quickly retraced within a couple of sessions.
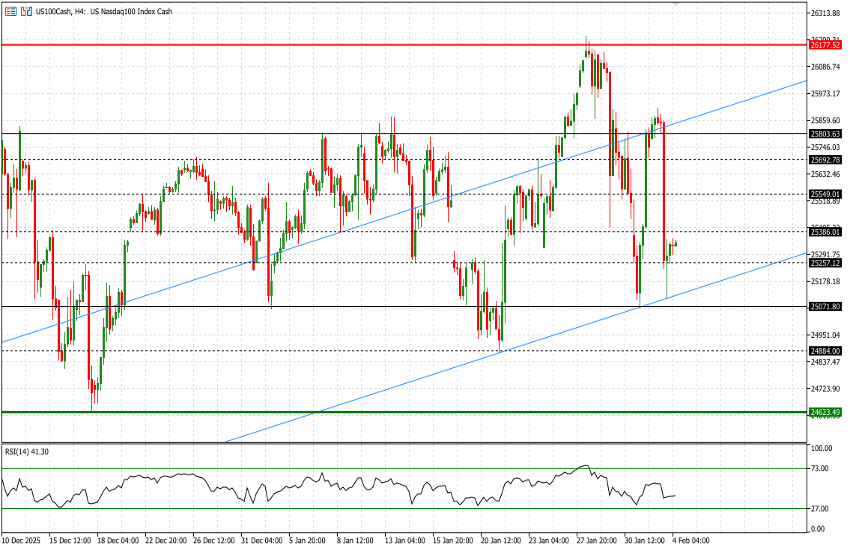
Key levels to monitor are 25,075 on the downside and 25,800 on the upside, with several intermediate resistance levels currently relevant as the index trades around 25,335. The nearest resistance sits at 25,385, followed by 25,550 and then 25,700.
A break below 25,075 would expose 24,885 as the next meaningful support, ahead of a potential test of the 24,625 level. Particular attention should be paid to a possible break of the lower light-blue trendline, which currently runs through the 25,125 area. The four-hour RSI stands at 41, indicating a bearish bias.
In summary, the technical outlook is deteriorating, although the index has not yet experienced a decisive sell-off. Earnings releases today and tomorrow from two heavyweight constituents—Alphabet and Amazon—could prove pivotal in determining the Nasdaq’s medium-term direction.
