Skip to content
Risk warning: Our products are leveraged and carry a high level of risk, which can result in the loss of your entire capital. Such products may not be suitable for all investors. It is crucial to understand the risks involved fully.
  • Support
  • For Institutionals
  • Trading

    Trading Platforms

    • MetaTrader 4 Terminal
    • MetaTrader 5 Terminal
    • PAMM Accounts
    • Equinix Trading Server

    Markets coverage

    • Forex Currencies
    • Spot Metals
    • Commodities


    • CFDs on Stocks
    • Indices
    • CFDs on Crypto

    Start Trading

    • Standard Accounts For individuals
    • Institutional Account For professionals
    • Deposits & Withdrawals
  • Conditions

    Trading Conditions

    • Spreads Overview
    • Swap-Free
    • Leverage Information


    • CFD Specifications
    • Full Trading Conditions

    Invest on your terms

    Transparent pricing, reduced trading costs, and leverage that adapts to your strategy.

    Explore conditions
  • Tools
    • Weekly Outlook
    • Daily Technical
    • Market Commentary
    • Economic Calendar
    • News & Insights
  • About
    • About OnEquity
    • Company News
    • Legal Documentation
    • Client Protection
    • Help & Support
    • FAQs
  • Partners
Edit Content
  • English
    ACTIVE
Other languages:
  • Español – Spanish
  • Português – Portuguese
  • English – International
  • Trading
    • Markets Coverage
    • MetaTrader 5 Platform
    • MetaTrader 4 Platform
    • Standard Accounts
    • Institutional Account
    • PAMM Accounts
    • Equinix Trading Server
    • Deposits & Withdrawals
  • Conditions
    • Spreads Overview
    • Leverage Information
    • Swap-Free Trading
    • CFD Specifications
    • Full Trading Conditions
  • Tools
    • Daily Technical
    • Weekly Outlook
    • Market Commentary
    • Economic Calendar
    • News & Insights
  • About
    • About OnEquity
    • Company News
    • Legal Documentation
    • Client Protection
    • Help & Support
    • FAQs
  • Partners
  • Client Portal
  • Open Account
Edit Content
  • English
    ACTIVE
Other languages:
  • Español – Spanish
  • Português – Portuguese
  • English – International
Open Account
Client Portal
Analysis, Daily Technical

Daily Technical Analysis EUR/USD: Falls to 1.0200, Multi-Week Low Due to Tariffs

February 3, 2025 OnEquity

During the early hours of Monday, the EUR/USD currency pair witnessed a significant decline, falling to the 1.0200 area, marking a three-week low. This movement brings spot prices dangerously close to the two-year low established in January, leading some investors to question whether the pair is entering a prolonged downtrend that has persisted for several months.

A massive rally in the US dollar (USD) across the board is primarily attributed to the newly imposed tariffs by US President Donald Trump. Over the weekend, it was announced that a 25% duty would be imposed on imports from Canada and Mexico, in addition to a 10% tariff on goods from China. This hardline stance signals the potential start of a global trade war, discouraging risk appetite in the markets. Consequently, there has been a significant flight to safe-haven assets, supporting the USD and increasing selling pressure on EUR/USD.

In a separate development, President Trump announced on Friday his intention to impose tariffs on products imported from the European Union, further aggravating the euro’s situation. This comes alongside the European Central Bank’s (ECB) dovish stance, which has systematically weakened the euro. The euro has remained under pressure since the ECB cut borrowing costs by 25 basis points last Thursday and hinted at further reductions in December.

This dovish ECB stance sharply contrasts with the Federal Reserve’s (Fed) hawkish position, reinforcing expectations of further EUR/USD depreciation. However, the recent decline in US Treasury bond yields may hinder the dollar’s upward trajectory, potentially offering some near-term support to the euro.

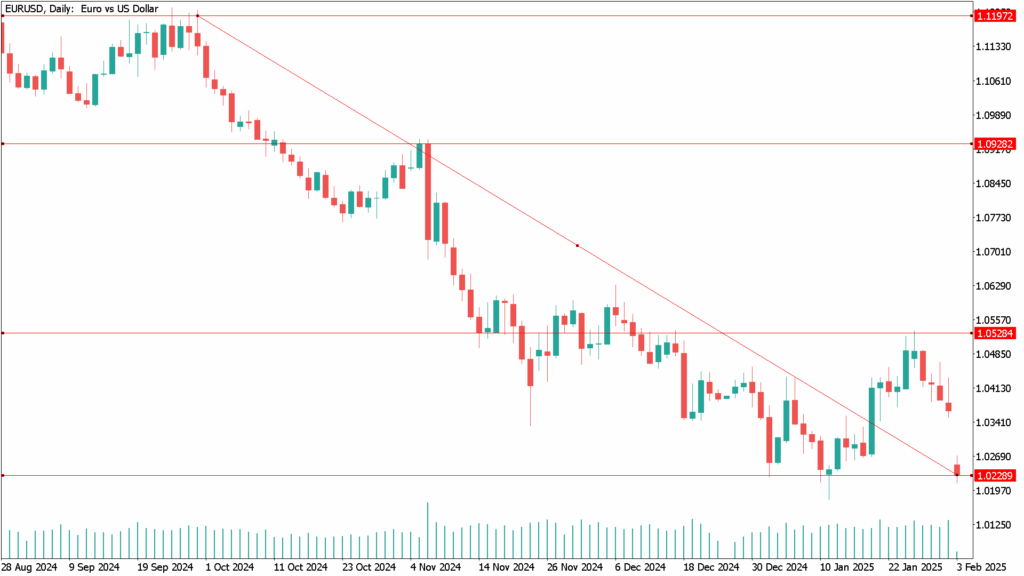
EUR/USD Daily Technical Analysis for February 3th:

An analysis of the EUR/USD daily chart reveals several key dynamics that may influence the pair’s behavior in the short term. Currently, the pair is near the 20-period simple moving average (SMA), which maintains a slightly upward tilt. However, the 100-period and 200-period SMAs remain significantly higher, signaling strong resistance at these levels.

From a technical indicator perspective, momentum remains neutral, oscillating around the 100-line without a clear directional bias. In contrast, the Relative Strength Index (RSI) has recently been trending downward and is currently at 47. If the pair breaks below the key 1.0350 level, this move would be significant.

If EUR/USD succumbs to selling pressure and falls below 1.0350, the next critical support level is at 1.0300. A breach of this mark could push the pair toward its January low of 1.0177. On the resistance side, the pair faces an initial barrier at 1.0450, followed by a stronger resistance level at 1.0532, the previous weekly high.

These support and resistance levels, along with technical indicators, suggest that traders must closely monitor market signals in the coming days. Careful attention to these factors will be essential for making well-informed trading decisions in the EUR/USD market.

EUR/USD chart
  • Analysis
  • Dollar
  • Euro
  • Technical

Post navigation

Previous
Next

Search

Categories

  • Analysis (217)
  • Beginner (24)
  • Cryptos (145)
  • Currencies (188)
  • Daily Technical (147)
  • Education (64)
  • Expert (23)
  • Intermediate (17)
  • Markets (434)
  • News & Releases (22)
  • Stocks (290)
  • Uncategorized (1)
  • Weekly Outlook (69)

Recent posts

  • Trading Hours Update – Additional Changes for August 2025
  • Today’s stocks to watch: Berkshire, Boeing, and Amazon
  • U.S. stock futures rise on heightened hopes for interest rate cuts

Tags

Analysis Bitcoin Cardano CPI Crypto Cryptocurrencies Currencies Daily Dollar earnings Education Elections ETF ETFs Ethereum Euro Fed Index inflation Litecoin Market Markets Nasdaq oil Outlook Pound Ripple SEC Solana Stablecoin Stock Market Stocks Stocks Market Stocks today Technical Technical Analysis Technology Tether Trading Trump Wall Street Weekly Weekly Outlook Yen Yuan

Related posts

Analysis, Daily Technical

Daily Technical Analysis EUR/USD: Surge Slows at Multi-Year Highs — Tax Reform and Yields Bring Gains to a Stop

July 2, 2025 OnEquity

The EUR/USD pair remained flat during Wednesday’s session, hovering around 1.1780 after briefly touching a multi-year high of 1.1830. The euro’s advance lost steam following the U.S. Senate’s approval of President Trump’s $3.3 trillion “One Big Beautiful Bill,” which includes the entirety of his legislative agenda. The bill, passed by a 51–50 margin with Vice […]

Currencies, Markets

Dollar Drops to Multi-Year Lows, Rate Cuts, Trade Agreements, and Tax Reform in the Public Eye

July 1, 2025 OnEquity

The U.S. dollar extended its decline on Tuesday, falling to multi-year lows amid growing expectations of Federal Reserve rate cuts and rising fiscal concerns sparked by President Donald Trump’s spending bill. By 04:25 ET (08:25 GMT), the U.S. Dollar Index—measuring the greenback against a basket of six major currencies—was down 0.2% at 96.275, marking its […]

Analysis, Weekly Outlook

Outlook for the Week of June 29 – July 4

July 1, 2025 OnEquity

The week of June 29–July 4 promises to be pivotal for global markets, with investors watching key economic data and central bank signals amid lingering geopolitical risks. In the U.S., focus will center on core PCE, ISM PMIs, and the jobs report, which could shift expectations for Fed rate cuts, while political tensions over Fed […]

  • Privacy policy
  • Client agreement
  • Legal
  • Support
  • +2484671965
  • [email protected]
  • Chat with us
Company
  • About us
  • Regulation
  • Safety of funds
  • Company news
  • Insights
  • FAQ
Account options
  • Standard accounts
  • Institutional account
  • PAMM accounts
  • Swap-free account
Conditions
  • Spreads overview
  • Leverage tiers
  • CFD specifications
  • Markets coverage
Trading tools
  • MetaTrader 5
  • MetaTrader 4
  • Equinix trading server
  • Economic calendar
  • Daily technical
  • Weekly outlook
  • Market commentary
OnEquity Ltd is incorporated in Seychelles as a Securities Dealer with License No. SD154, authorized by the Seychelles Financial Services Authority (FSA), adhering to the Consolidated Securities Act, 2007. Registration No. 810588-1.

The website is operated and provides content by the OnEquity group of companies, which include:

OnEquity SA (Pty) Ltd, incorporated in South Africa, Company reg. 2021/321834/07, regulated by the Financial Sector Conduct Authority (FSCA) with FSP No. 53187.

OnEquity LLC, recognized by the Registrar of International Business Companies and the Financial Services Authority in St. Vincent and the Grenadines, Registration No. 286 LLC 2020.

ONEQ Global Ltd, registered in Cyprus, Company reg. HE 435383, located at Agias Zonis 22, Limassol, focusing on comprehensive service solutions within the OnEquity Group.
Risk Disclosure: Trading in financial instruments involves substantial risk and may not be suitable for all investors. The value of investments is volatile and can result in total loss of capital. Investors should consider their financial situation, investment experience, and risk tolerance, and may seek professional advice. Past performance is not indicative of future results.

Eligibility: Services are available to individuals 18 years or older.

Restricted Jurisdictions: The content provided by OnEquity is not intended for residents of the United States, Canada, North Korea, Yemen, Iran, Belgium, Syria, or any jurisdiction where such distribution or use would be contrary to local law or regulation.

All trademarks™ and brand names belong to their respective owners and are used here for identification purposes only. Use of these names does not imply endorsement.
© OnEquity. All Rights Reserved.