Brent Surges 29%, Spread with WTI Briefly Hits 0

This morning, Brent crude surged by 29%, reaching $119.50 per barrel, briefly matching the spread with WTI—typically positive—and bringing it close to zero. The intraday high for U.S. crude was $119.40. This shock start to the week adds to the gains recorded over the last five trading sessions, totaling 35%—the biggest gain in futures trading history since records began in 1983.
Over the weekend, on Saturday, Kuwait announced cuts to its production and refining activity without specifying the exact magnitude. The fifth-largest producer in OPEC typically produces around 2.6 million barrels per day. Meanwhile, extraction activity in Iraq is collapsing due to a lack of storage capacity, with at least 1.5 million barrels per day effectively removed from the market as production in the main southern fields has fallen by roughly 70%.
Earlier this morning, Bapco Energy in Bahrain—the country’s largest oil company—and QatarEnergy declared force majeure. This is a legal concept used in contracts to excuse a party from fulfilling its obligations when extraordinary events beyond its control make performance impossible or impractical. In practical terms, it means: we will no longer deliver oil without incurring legal penalties, and in many cases any payments already made in advance will not be refunded.
At the time of writing, both WTI and Brent have retraced from the vertiginous highs reached just a few hours ago—levels not seen since the 2022 invasion of Ukraine—and are currently trading at +11.90% and +14.42%, respectively.
Technical Analysis
Before looking at the Brent chart, given the extreme volatility it is useful to first examine the Brent–WTI spread. The two contracts obviously display similar, though not identical, price behavior. The comparison of their historical series can be considered relatively stationary, creating a solid opportunity for spread trading—buying one contract while simultaneously selling the other, thereby reducing directional risk and trading the divergence between the two.
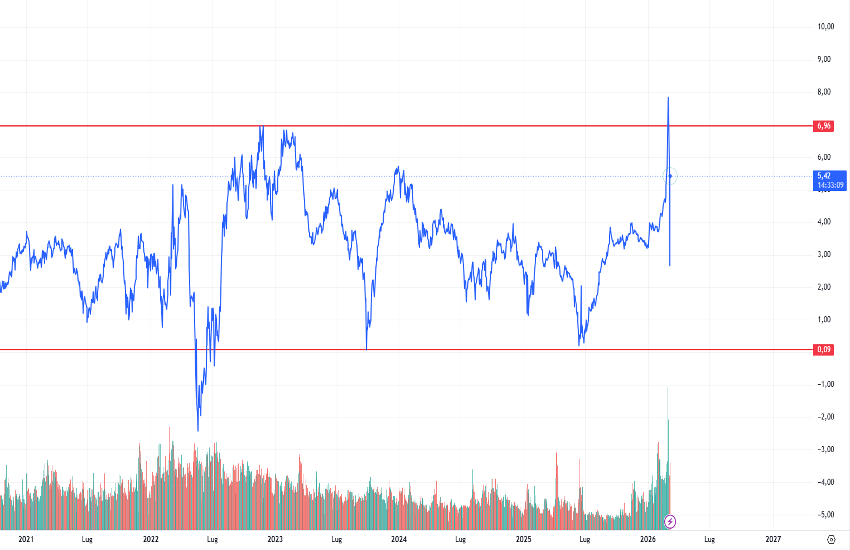
As shown in the chart below, since at least 2021 Brent and WTI have traded within a spread range of roughly $0 to $7. The UK Brent benchmark normally trades at a premium to onshore WTI, meaning it is generally more expensive. As with any range-bound time series, the spread typically oscillates from one side of the range to the other. During these highly volatile sessions, the spread itself has also experienced extreme movements, fluctuating significantly from one session to the next.
As recently as last Monday, the spread widened to $7.80, while this morning—just five sessions later—it briefly tested $0, as mentioned earlier in this note. At present, it is widening again sharply to around $4.50 (the chart below is slightly delayed). Our working assumption is that in the coming frenetic hours the spread could expand again toward the $6–$6.50 area. From a trading perspective, this would imply going long Brent while simultaneously shorting WTI to benefit from such a widening.
Turning back to the standard Brent chart, we present only a weekly timeframe to highlight the explosive nature of the move. Once the downtrend line that had been in place since 2023 was broken, price rapidly cleared all major resistance levels—$78.50–$80.50, then $94—and this morning reached the peak area of 2022.
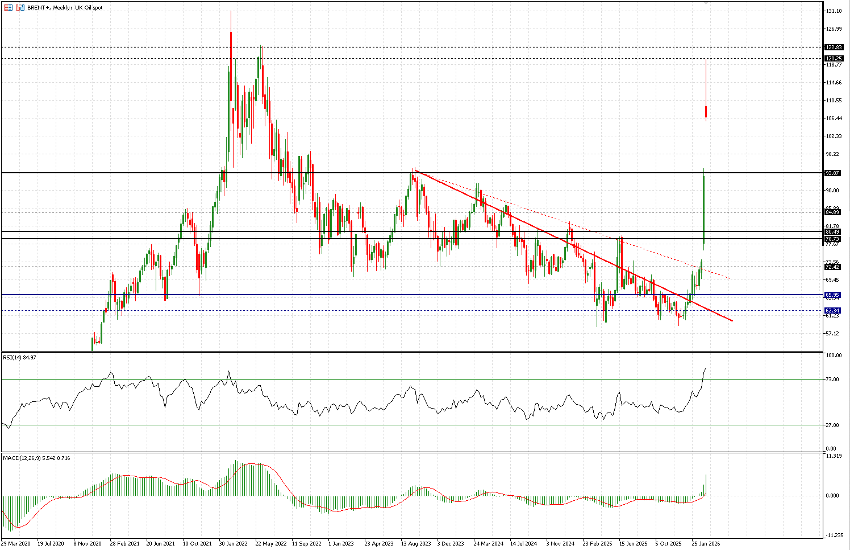
At the moment, the weekly RSI is deeply overbought, and the candle currently forming is a very long spinning top. In short, daily swings—often occurring within just a few hours—are extremely violent, allowing for aggressive trading opportunities on both the long and short side. However, despite the current situation and the constant flow of news that appears supportive for oil prices, taking an outright long position at this stage does not seem particularly prudent. In our view, trading the spread remains the preferable approach.