Microsoft (MSFT) Under Sustained Pressure

Microsoft shares have shed roughly 30% from their all-time highs, reached intraday on October 28 last year at $551.43, making MSFT the worst-performing name among the Magnificent Seven over the past six months—with the stock now off to its worst start to a year since 2008.
The sell-off is not a reflection of deteriorating fundamentals per se—fiscal Q2 revenue came in at $81.3 billion, up 17% year-over-year, with diluted EPS surging 60% to $5.16—but rather a market re-rating driven by a widening gap between AI spending and monetisation. Capital expenditures reached $37.5 billion in the quarter alone, two-thirds of which went into short-lived assets such as GPUs and CPUs, up from $64.6 billion for the entirety of fiscal 2025. Investors are increasingly questioning the return profile of this spend.
Compounding the concern, OpenAI—which accounts for 45% of Azure’s backlog—was expected to share IP that would fast-track Microsoft’s AI competitiveness against Google, but that arrangement has not visibly enhanced Copilot’s performance. This has forced the company to increase spending on its own R&D while consuming internal Azure capacity that could otherwise generate customer revenue. Meanwhile, broader fears that generative AI could render Microsoft’s high-margin enterprise software suite obsolete have led analysts to re-rate the earnings multiple, accelerating the sell-off into 2026. In short, the market entered this cycle pricing in accelerating growth; what it got was stabilising Azure expansion and a capex trajectory that shows no signs of moderating—a combination that has consistently weighed on sentiment and kept the stock under pressure.
Technical Analysis
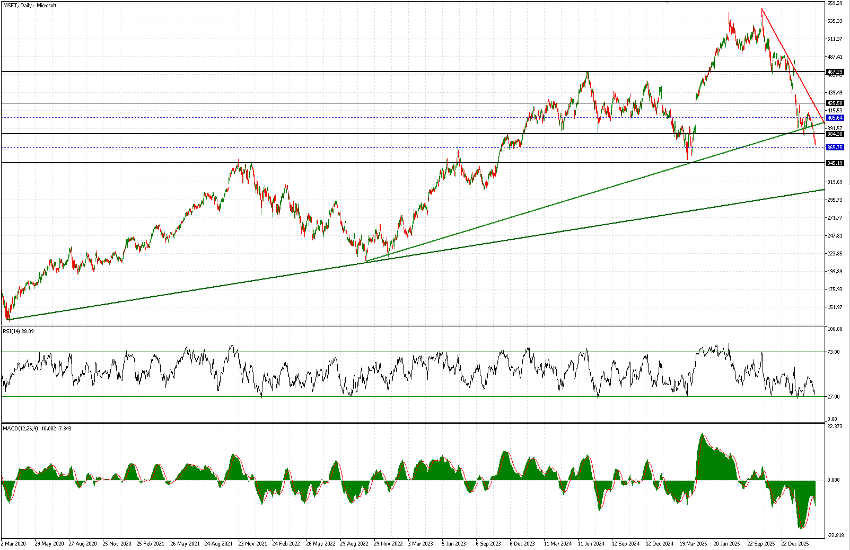
The best way to appreciate the magnitude of MSFT’s move ($370.42) is to start from a long-term chart—specifically a five-year view—where two key trendlines supporting the stock’s rally since 2020 become evident. The more recent and steeper trendline, originating in August 2022 around $213, now appears to have been decisively broken. The breakdown occurred around $395 on March 19 (following an initial failed attempt on February 23), which is clearly a negative signal. This is particularly concerning because the less steep trendline, dating back to 2020, currently lies much lower, around the $310 area.
In between, there is an intermediate support level (highlighted with blue dashed lines) at $365.75, as well as a more significant support at $345. On the upside, $384 has just been lost and is now likely to act as a strong resistance level. Meanwhile, price action continues to develop within a clearly defined downtrend, and indicators—although somewhat reset—are not yet in oversold territory, nor do they show clear signs of divergence or reversal.
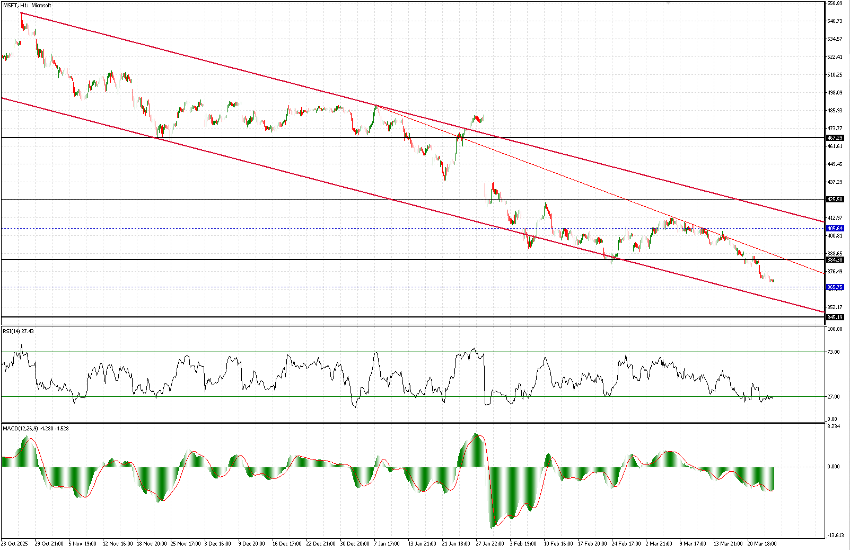
Zooming into a shorter timeframe, down to the one-hour chart, and focusing on the decline that began in late October, it appears there may still be further downside potential toward a range between $365 and $345 (more likely toward the lower end). This would imply additional downside of approximately 5%–7.5%. When the stock eventually finds buying interest, price action will also face resistance from the steeper internal trendline within the channel—the same one that rejected prices in early March.
The only constructive signal at this stage is that, on the one-hour timeframe, early signs of a potential (albeit premature) reversal are beginning to emerge in the indicators.
That said, with a stock like this, the old adage still applies: “never try to catch a falling knife.”