US30 Rebounds at Key Support

Two of the three major U.S. equity indices have now entered correction territory—defined as a drawdown of 10% from their recent highs. Only the S&P 500 remains just above that threshold, currently at -9.05%, while both the Nasdaq and the Dow Jones Industrial Average have breached it. For completeness, the Russell 2000 could arguably be included in this group as well.
The Dow Jones Industrial Average was the first to enter correction territory last Friday, standing at 45,166 and down -10.58% from its February 10 intraday high. It was subsequently followed במהלך the same session by the Nasdaq 100, which posted a notably weak daily performance of -1.96%. Both Thursday and Friday last week were marked by sustained and orderly selling pressure throughout the trading sessions—an indication of the underlying strength and conviction behind the move.
As the duration of the conflict extends, investors are increasingly concerned that the repercussions for the global economy may prove both severe and difficult to mitigate. A growing number of equities are exhibiting technically fragile—and in some cases alarming—chart patterns. This is particularly evident in names such as Meta and Microsoft, as noted last week. Others, including Alphabet and even the previously resilient Nvidia, are beginning to show signs consistent with late-stage deterioration. Even within the semiconductor space, former market leaders such as AMD, Qualcomm, and Micron—despite its strong performance so far in 2026—are starting to resemble “fallen angels.”
This morning, following the pronounced sell-off in recent sessions, equity markets are attempting a rebound, while oil prices—both WTI and Brent—are modestly retreating from overnight highs (though still elevated at $100.76 and $115.08, respectively). The key question now is whether this move has the foundations to evolve into a more sustained recovery, or if it will ultimately prove to be nothing more than a classic “dead cat bounce.”
TECHNICAL ANALYSIS
The US30 is currently consolidating around a critical technical level at 45,100. This level is particularly significant as it corresponds to the highs reached in autumn 2024—effectively the peak of the previous cycle. It also aligns with the 38.2% Fibonacci retracement of the rally from 36,500 to 50,500. While the author does not place strong emphasis on Fibonacci analysis, its widespread use in market practice makes it a relevant reference point, particularly in contexts like this.
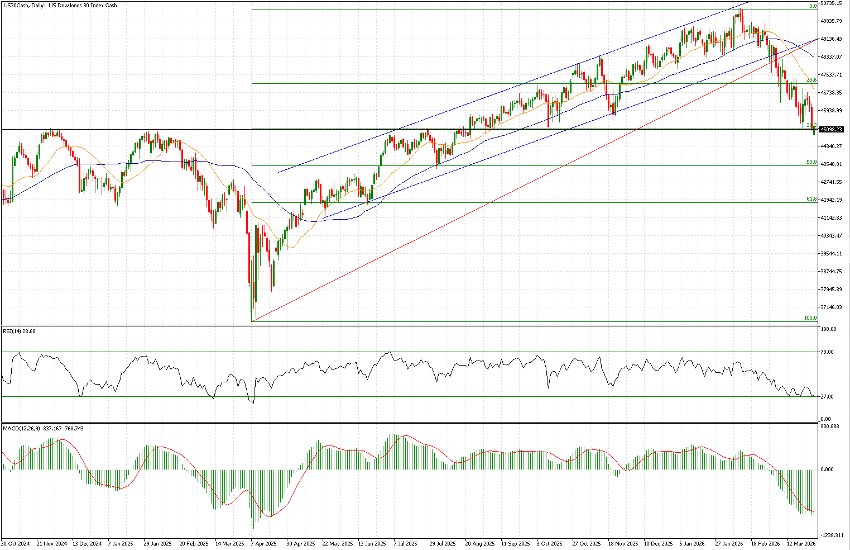
From a technical standpoint, the upward channel in place since May 2025 has been decisively broken. The 21- and 50-period moving averages have crossed to the downside and are trending lower, while both RSI and MACD are in oversold territory, with no evident divergence at this stage.
The 45,100 level represents a key inflection point where bulls may attempt to stabilize price action and engineer a short-term rebound. Failure to hold this support, however, could expose the index to a swift move toward the 43,500 area.
On the hourly chart, the downtrend that began on February 10 is clearly contained within a descending channel. However, momentum indicators continue to show limited signs of strength. The only marginally constructive signal is the MACD histogram turning positive, coupled with the fact that price did not retest the lower boundary of the channel during Friday’s session—though such a retest would likely have provided a more robust technical setup.
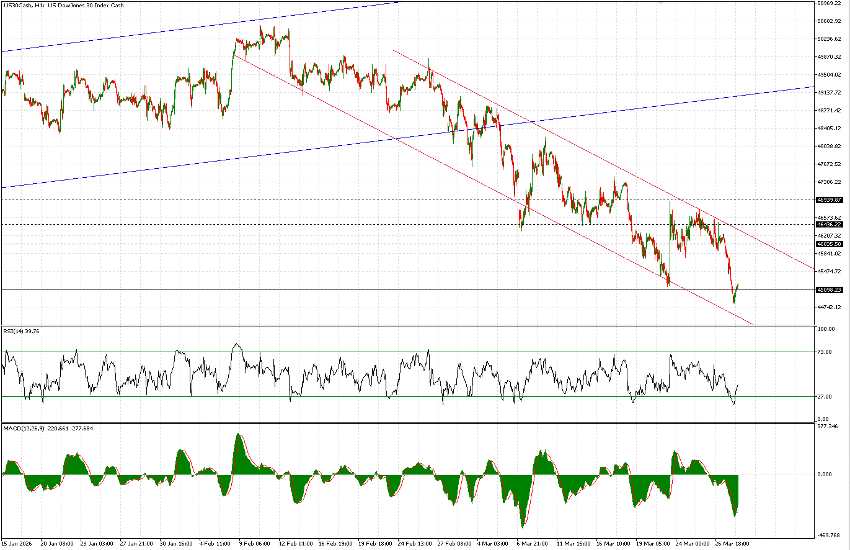
In summary, while the 45,100 level on the daily timeframe is both technically meaningful and a plausible base for a rebound (with current price action around 45,220 after a recent low near 44,800), the broader setup remains fragile. From a risk-reward perspective, there is greater conviction in fading strength at higher levels—potentially in the 46,050 area, with a stop-loss placed just above a confirmed channel breakout—rather than initiating long positions at current levels.
