OECD UK Downgrade: FTSE & GBPUSD Outlook

The OECD’s latest economic outlook, published on March 26, delivered a stark verdict on the UK who received the biggest downgrade to its 2026 growth forecast among all major OECD member countries, with GDP growth now projected at just 0.7% for the year, down 0.5% from a previous estimate of 1.2%. The downgrade reflects the country’s heavy reliance on imported energy, with rising gas prices expected to squeeze both households and businesses. The OECD now forecasts UK inflation averaging 4% in 2026 -up from 2.5% in its December projection- which would place Britain as the second-highest inflation rate in the G7, behind only the US.
Recent data already showed consumer confidence for the next three months collapsing in March following the escalation, with expectations for the state of the economy plunging to -53 from -30 in February while sentiment on personal finances fell to -17 from -6: both are records lows. For businesses, the energy spike is set to worsen cost pressures for UK firms, which already face the highest industrial energy costs in the G7 squeezing margins at a time when domestic demand remains subdued and fiscal tightening continues to act as a headwind.
Talking about interest rates, heading into 2026 the market was predicting that the BoE might cut the base rate at least one more time, with a 50-50 chance of a reduction as early as March 2026. That consensus was upended by the escalating conflict in the Middle East: at its March 19 meeting, the MPC voted unanimously 9-0 to hold the base rate at 3.75%, a dramatic reversal from the sharply divided 5-4 vote in February. Sterling IR swaps have risen materially in response, with the 5-year GBP rate near 4.25%, compared to 3.60% prior to the commencement of US-Israeli strikes. Overnight index swaps are now pricing in the possibility of a rate hike in 2026, with the base rate potentially rising above 4% in 2027.
For asset markets, this stagflationary cocktail creates a difficult backdrop. On GBPUSD, the compression of BoE rate-cut expectations has offered the pound some near-term support, though the UK’s weaker growth signals relative to the US remains a dominant driver of price action, likely keeping the pair in a constrained, choppy range. On the FTSE 100, the picture is similarly bifurcated: rate-sensitive sectors such as housebuilders and utilities face headwinds from a higher-for-longer rate environment, while the index’s heavy concentration in energy and banks may provide a partial natural hedge against the very energy shock weighing on the broader economy.
TECHNICAL ANALYSIS
Let’s begin with a daily chart of the UK100, as it is currently both interesting and technically clear. The index, which had declined by -11.56% from the February 27 high to the March 23 intraday low, is now showing strength for a meaningful rebound. At yesterday’s cash close (10,127.96), it was up +4.73% from the recent lows at 9,670.
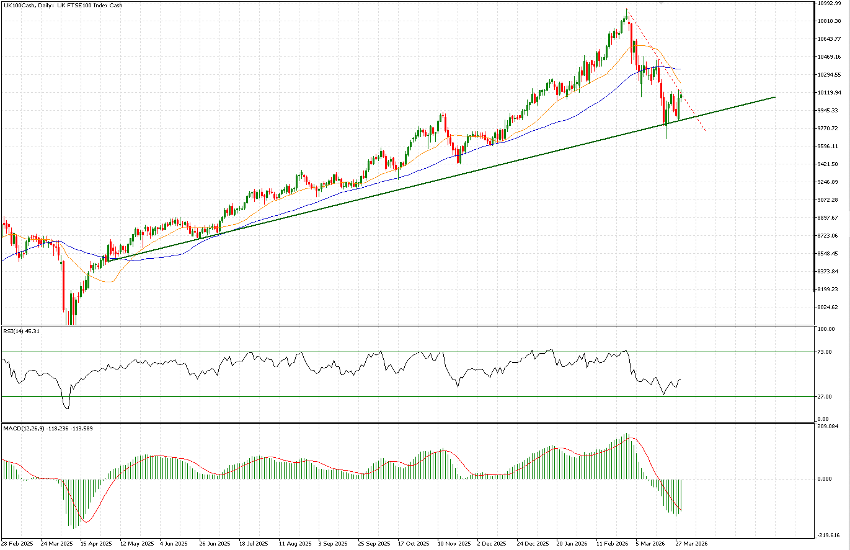
Importantly, the index has managed to rebound from the moderately upward-sloping trendline in place since last April, without ever closing below it. Admittedly, the 21- and 50-day moving averages have crossed to the downside and are acting as resistance, as is the trendline the index is currently testing (red dashed line). However, the RSI is already returning to more neutral levels (around 45, coming from oversold territory just seven sessions ago), and the MACD histogram is also turning upward.
The current level of 10,100 is therefore key on the upside today. A confirmed break above this level would be a positive signal, opening the way toward the next targets at 10,200 and then approximately 10,360. On the downside, the 9,860 area is crucial; a break below it would likely trigger a more prolonged bearish move.
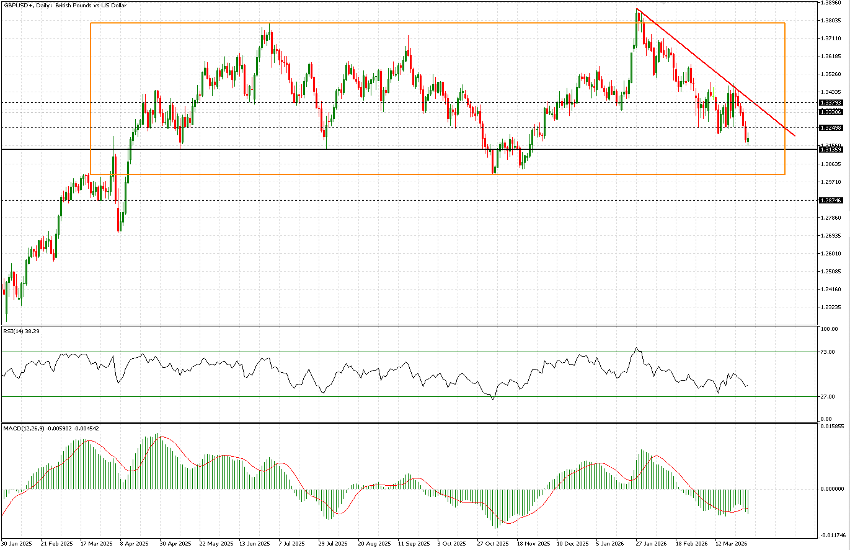
As for GBP/USD, 1.3135 represents a pivotal level. In July 2023, the rally of that year lost momentum at this level, and during 2024 the pair’s strength also faded around it. Within the current broad long-term range, the pair is trading near the lower boundary, with a low of 1.30 reached at the end of October last year, while the upper range can be identified between a more substantial zone around 1.36 and brief peaks above 1.38.
The price is currently below a short-term trendline, which today would pass near 1.34. Additional levels to monitor on the upside are 1.3250, 1.3330, and 1.3380. Should both 1.3135 and 1.30 be broken in the coming weeks, it would suggest increased downside pressure. However, at present, our bias remains for continued choppy trading within a range that is expected to hold for the time being.