WTI Slides to Key Support at $92.50

The two-week truce announced in the clashes between Iran and the U.S./Israel has immediately boosted equity markets and caused oil prices to decline sharply.
At the time of writing, WTI crude oil is trading at $94.85 (-14.10%), while Brent is down to $93.18 (-10.18%). Both benchmarks are now well below last night’s settlement levels, which were close to or above $110. The truce is associated with the immediate reopening of the Strait of Hormuz, raising expectations that flows may begin to normalize.
However, the underlying situation remains complex. Dozens of production sites across the region have been impacted—from Iran to the UAE, Saudi Arabia, and Qatar. Some facilities may require years to return to full production (as is the case with the Ras Laffan LNG facility, the world’s largest LNG export site). It is therefore critical that the least damaged sites resume operations quickly, as prolonged shutdowns can lead to corrosion and structural damage.
The 20 million barrels per day that typically transit through the Strait are well known; less visible is the scale of production disruption across Gulf countries, which is difficult to quantify but is estimated at around 11 million barrels per day. Currently, roughly half of regional production capacity is offline.
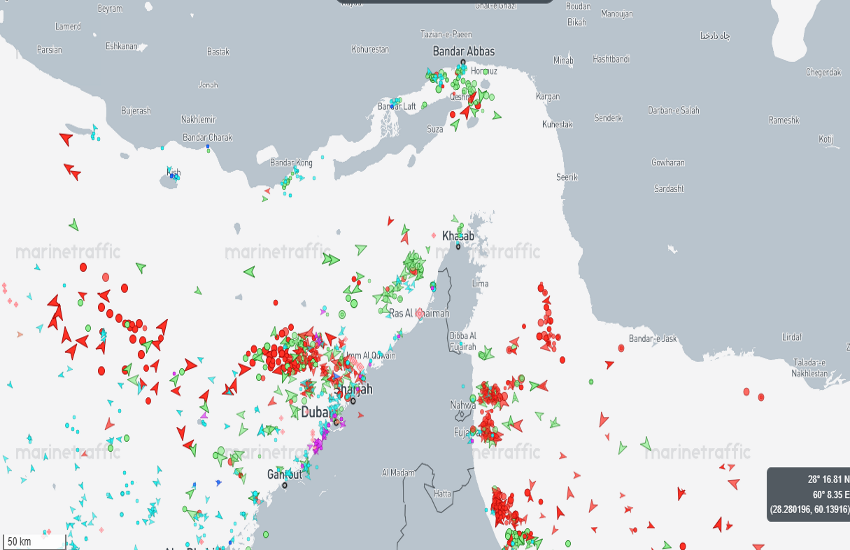
In the image below, real-time vessel traffic through the Strait shows limited activity, with tankers positioned on both sides. However, insufficient time has passed since the announcement to confirm a sustained normalization in flows.
Despite the truce, both major oil benchmarks are now trading below $100—and even below $95. WTI continues to trade at a premium to Brent, which is unusual, though this is partly explained by technical factors: WTI remains on the May contract, while Brent has rolled to the June 2026 contract, with the curve in strong backwardation.
Technical Analysis
On the 4-hour chart, the steep trendline that developed during the escalation phase was broken this morning, signaling a potential shift in short-term momentum.
The horizontal levels marked in blue represent historically significant areas, primarily derived from the 2022 spike (which reached highs around $126, compared to nearly $120 in the current move). The black levels reflect more recent price action.
The $95.50 level was pivotal in 2022; once broken, price gradually declined toward $82 over approximately three months, before extending to $73 by December.
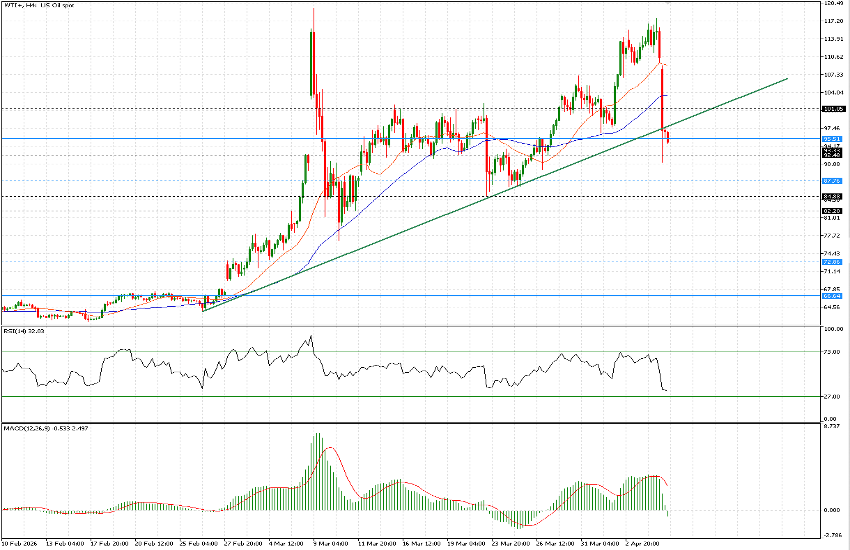
The $92.35 level—close to today’s low at $91.15—is more relevant in the current context, having acted as support and resistance between March 13 and March 27. Below this, key levels to monitor are $87.75 and the $85 area.
At this stage, further downside appears limited in the near term. The $82.20 level remains a more ambitious short-to-medium-term target, which is not currently the base case.
In the near term, consolidation around $92.50 appears more likely, although the risk of upward spikes toward $101 remains.