AUDUSD Extends Decline After 0.7150 Rejection

Despite some unimpressive macro data, the USD continues its slow and gradual strengthening after the collapse of the last 10 days of January—a move that has now been ongoing for 21 sessions.
No one will have missed the poor print of the Q4 GDP Growth Rate, which came in at just +1.4%, down from the previous +4.4% reading and well below expectations. More attentive observers may also have noted the trade balance data, which has been negative for decades and is probably one of the real underlying reasons behind tariff policies. After a period of deficit narrowing that began in April 2025 and brought it to -$29 billion in August—the lowest level in at least 10 years—the imbalance between imports and exports has widened significantly again, reaching -$70 billion in the latest available data for December 2025. Anyone familiar with economic orthodoxy knows that this is normally considered to be one of the worst factors for a currency’s strength -or at least, this is what is taught at Universities.
Nevertheless, the long end of the curve has been heavily bought during this period—particularly the 10- to 30-year Treasuries—and for doing so you need dollars and this is likely one of the reasons behind the current strengthening.
The USDX has now traded for four sessions slightly above the pivot level we had identified around 97.35 / 97.50 (corresponding to the opening of the gap down left on Monday, January 26), and yesterday it rebounded toward the close at 97.65 after another test of that area.
Among the many available pairs, from a technical standpoint AUD/USD caught our attention yesterday.
TECHNICAL ANALYSIS
We absolutely need to start from the long-term chart. After months of weakness, with a low around 0.59 during last spring, the Aussie began a strengthening phase that saw it break above the long-term descending trendline (red line) at the end of December 2025.
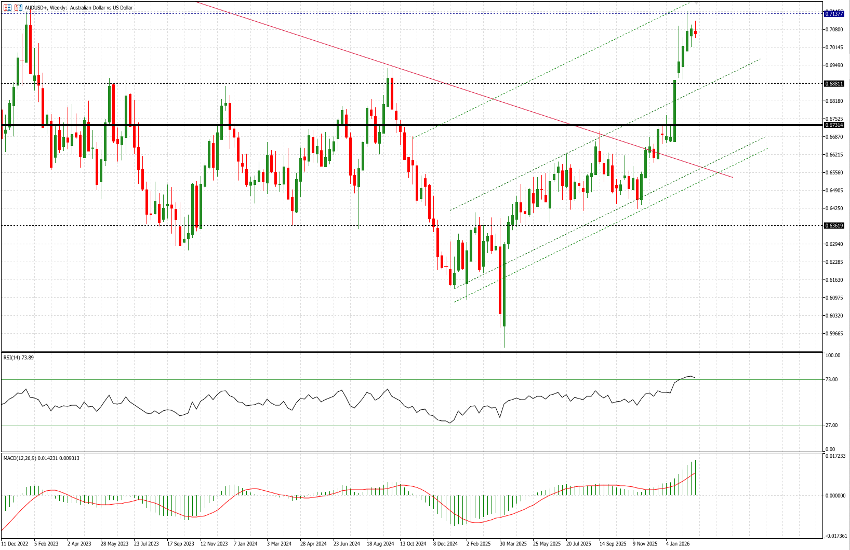
Following a brief consolidation period lasting about three weeks, it found the momentum to break through the 0.6750 resistance area and continue with the subsequent leg up, which propelled it decisively above the 0.6880 resistance and up to test the 0.7150 zone—a level that had proven crucial at least twice in late 2022.
After testing 0.7150 on February 11 and 12, AUD/USD has started to pull back again and is currently trading at 0.7065, less than one handle lower.
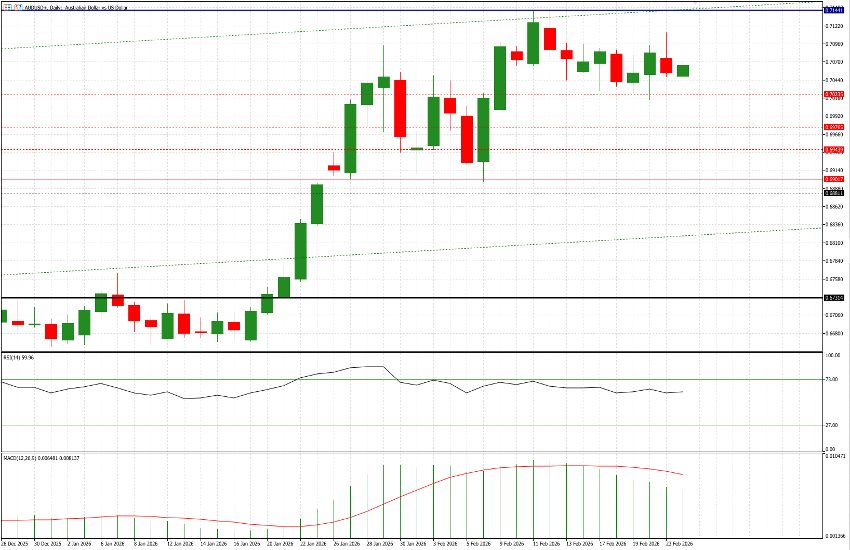
What caught our attention, however, is the type of candle printed yesterday: a sort of inverted hammer with a long upper shadow. This kind of formation, especially after a rally, can signal a pause or even a potential trend reversal. If we combine this with the long-legged doji from January 29 and the (bearish) inside structure that formed during the test of 0.7150, the overall setup warrants close monitoring of the pair.
In the event of a meaningful correction, we will need to watch 0.7020, 0.6975, 0.6945, and finally the 0.6900 level very carefully.
