Cocoa: From Euphoria to Structural Correction

What unfolded in the cocoa market between early 2024 and December of that year was, by any measure, one of the most extraordinary commodity rallies in modern market history—and one that retail traders would do well to study as a textbook case of supply-shock-driven parabolic pricing. The December 2024 record high of $12,931 per ton smashed the previous all-time peak of $5,104 per ton set in 1977, a record that had stood for 47 years.
The fundamental catalyst was severe: the global cocoa market registered its largest deficit in over 60 years in the 2023/2024 marketing year, driven by catastrophic crop failures in Ivory Coast and Ghana, which together account for over 70% of global output. By December 2024, however, the self-correcting mechanics of commodity markets had already been set in motion. Elevated prices were simultaneously incentivizing production recovery and destroying demand, with chocolate manufacturers reformulating recipes and consumers in price-sensitive markets cutting back on purchases.
What followed was one of the sharpest corrections in the soft commodities space in decades. From the $12,931 peak, the continuous futures contract plunged to a low of $2,822 per ton on March 6—a drawdown of nearly 78%.
The move was driven by both sides of the supply/demand equation unwinding simultaneously. Output recovered to 4.69 million tonnes in 2024/25, up 7.4% year-on-year, while grindings—a proxy for demand—declined, pointing to something more structural than a simple harvest recovery. Weak buying interest translated into stock accumulation among major producers, with both Ivory Coast and Ghana struggling to move unsold beans.
The ICCO has raised its estimate for the 2024/25 global cocoa surplus to 75,000 metric tons, with global production estimated to have climbed 8.4% year-over-year to 4.7 million metric tons.
For traders, cocoa remains a market defined by extreme volatility. Those considering an entry on the long side should size positions conservatively and monitor West African weather developments closely, as any renewed supply disruption could reignite a market still structurally prone to violent swings.
Technical Analysis
The long-term trend is clearly visible on the chart and, at its steepest phase, spans nearly one year. It is possible to distinguish seven different waves: four deeper bearish waves and three shorter bullish waves with more limited extensions. Price action remains orderly within a defined channel.
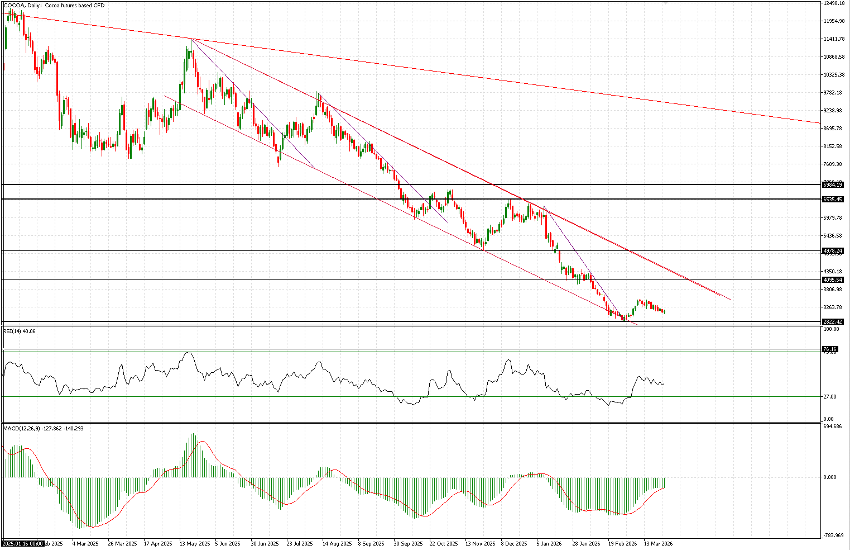
From a technical perspective, there are three key developments—without implying excessive optimism.
The lower boundary of the channel has just been tested, which has historically preceded sideways or slightly bullish price action.
The trendline that had kept prices in a strong downtrend since January (purple trendline) has been broken, which in the past has signaled a temporary relief from selling pressure.
Indicators are showing early and tentative signs of a potential recovery.
The key reference level remains the recent low at $2,822 per ton, which may serve as a base for strategy development. It represents a potential entry point—both for long and short positions—and allows for relatively tight stop-loss placement.
If the commodity finds sufficient momentum to rebound, upside targets are located at $3,500 and $4,095. A break above the latter would open the way toward $4,975; however, such a move would imply a break in the long-term trend and a broader shift in market structure.