FTSE 100 Weak but Holding Above 10,000

Several UK macroeconomic releases were published earlier today and they were disappointing across the board: GDP MoM came in flat at 0%, industrial production was also close to flat and below expectations, and the services index was weak as well. The GBP is feeling the impact, losing 0.41% against the USD today and also 0.06% versus the EUR. The FTSE 100 is suffering from the broader global environment like other equity indices, although this morning it is performing better than US indices, the DAX and the CAC 40.
Despite the country’s subdued economic performance—where perhaps only the sharp decline in inflation stands out as a genuinely positive development—the UK index has been among the top performers in recent months, competing with Spain’s IBEX 35 for the title of best performer. It closed 2025 up 22%, surpassing the 10,000 level for the first time, driven primarily by the mining sector (Glencore, Rio Tinto), aerospace and defence (Rolls-Royce Holdings, BAE Systems) and the financial sector. From the start of Q4 2025 to today the index is up 11.36%, despite the recent pullback that has taken prices from an intraday high of 10,934 to around 10,246 where it is currently trading.
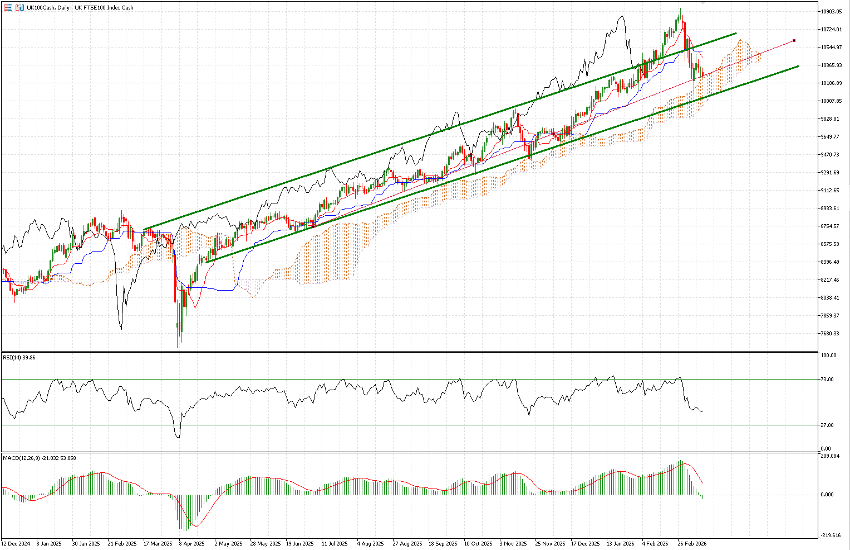
From a technical perspective the chart still looks relatively healthy, despite the roughly 6% decline seen in recent days. Price remains well within the upward channel that has been in place since early May 2025, with the lower boundary currently around 10,000, roughly 2% below current levels. The price has crossed below both the Tenkan and Kijun lines but it remains above the Ichimoku cloud, which could provide support in this area. In addition, the lagging indicator, the Chikou Span, has not yet crossed below the price, which would otherwise signal a stronger bearish shift. Both RSI and MACD show weakness: the RSI is currently at 39, while the MACD histogram has turned negative as of today.
Technical Analysis
Looking at the 1-hour timeframe some key levels become clearer. First, the price is clearly trading below a descending trendline which was tested overnight at 10,335. A strong support level lies near 10,220, with additional important levels at 10,135 and 10,060. It will be important to see a reaction around the latter level if the longer-term bullish trend is to remain intact.
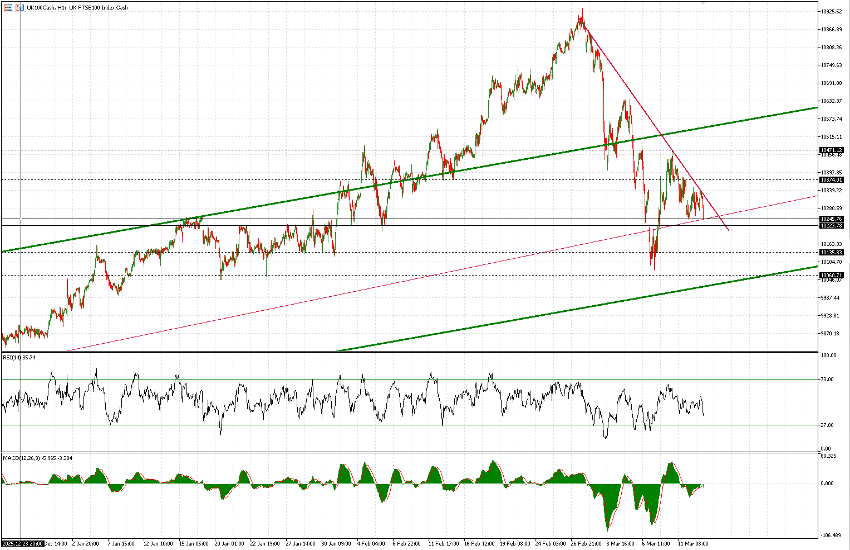
Should the index manage to rebound in this challenging environment, the red trendline will be the first level to monitor. Beyond that, 10,375 and then 10,470 represent interesting resistance levels. For now it may be premature to look much higher, although 10,630 and 10,750 could be mentioned as further resistance zones in what would, at this stage, be only a tentative attempt to retest the highs over the coming weeks.
