S&P 500: Assessing the Rebound

Last week was, overall, quite positive for equity indices and the global benchmark. After an initial rebound attempt that quickly faded on Monday, March 30, the following day the S&P 500 posted a solid +2.86%—also coinciding with the close of the first quarter and related last-minute rebalancing—which then allowed it to continue rising in the following days.
Particularly notable was the candlestick formed on Thursday, April 2: after a very negative start to the session, the S&P recovered all losses and closed at +0.07% (with an intraday range of 2.16%), forming a hammer pattern.
On a weekly basis, the index posted a +2.99% gain, despite both oil benchmarks continuing to trade above $110 and ongoing damage to Middle Eastern energy infrastructure suggesting potential long-term disruptions in production and supply. Investors and traders appeared willing to price in a potential resolution, fueled by rumors of a possible truce—particularly given oversold conditions and proximity to key support levels.
The situation is now at a crossroads. The rebound has pushed price above the key 6536 level, where the index consolidated during yesterday’s low-volume session. Today’s opening was slightly above the next resistance area at 6610, as well as above the 21-day moving average and the clearly defined downtrend line originating on February 25.
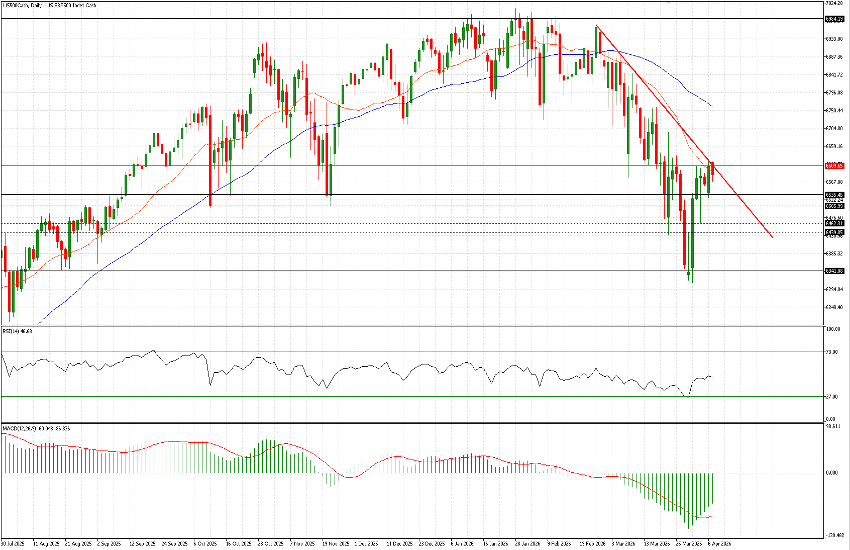
This type of price action above key levels may suggest that a breakout is approaching. Such a move would be a positive medium-term signal and could open the door to further gains, potentially toward the 6700–6730 area.
However, several factors still call for caution. First, volumes have declined sharply during the latter part of the rebound. Second, on the S&P 500 cash (spot) chart (i.e., the New York session), price has not touched or broken the downtrend line (as chart structures differ slightly).
Finally, relative performance across indices remains uneven: while the US30 shows a similar attempt to break its downtrend, the Nasdaq—arguably the cleanest chart—still points toward a continuation of the broader bearish trend.
In summary, caution remains warranted. In such volatile environments, markets often retest recent lows before establishing a sustained move higher. Key levels to monitor are 6535, followed by 6505. A move lower into the 6430–6460 area would bring 6350 back into focus.
