Skip to content
Risk warning: Our products are leveraged and carry a high level of risk, which can result in the loss of your entire capital. Such products may not be suitable for all investors. It is crucial to understand the risks involved fully.
  • Support
  • For Institutionals
  • Trading

    Trading Platforms

    • MetaTrader 4 Terminal
    • MetaTrader 5 Terminal
    • PAMM Accounts
    • Equinix Trading Server

    Markets coverage

    • Forex Currencies
    • Spot Metals
    • Commodities


    • CFDs on Stocks
    • Indices
    • CFDs on Crypto

    Start Trading

    • Standard Accounts For individuals
    • Institutional Account For professionals
    • Deposits & Withdrawals
  • Conditions

    Trading Conditions

    • Spreads Overview
    • Swap-Free
    • Leverage Information


    • CFD Specifications
    • Full Trading Conditions

    Invest on your terms

    Transparent pricing, reduced trading costs, and leverage that adapts to your strategy.

    Explore conditions
  • Tools
    • Weekly Outlook
    • Daily Technical
    • Market Commentary
    • Economic Calendar
    • News & Insights
  • About
    • About OnEquity
    • Company News
    • Legal Documentation
    • Client Protection
    • Help & Support
    • FAQs
  • Partners
Edit Content
  • English
    ACTIVE
Other languages:
  • Español – Spanish
  • Português – Portuguese
  • English – International
  • 日本語 – Japanese
  • Trading
    • Markets Coverage
    • MetaTrader 5 Platform
    • MetaTrader 4 Platform
    • Standard Accounts
    • Institutional Account
    • PAMM Accounts
    • Equinix Trading Server
    • Deposits & Withdrawals
  • Conditions
    • Spreads Overview
    • Leverage Information
    • Swap-Free Trading
    • CFD Specifications
    • Full Trading Conditions
  • Tools
    • Daily Technical
    • Weekly Outlook
    • Market Commentary
    • Economic Calendar
    • News & insights
  • About
    • About OnEquity
    • Company News
    • Legal Documentation
    • Client Protection
    • Help & Support
    • FAQs
  • Partners
  • Client Portal
  • Open Account
Edit Content
  • English
    ACTIVE
Other languages:
  • Español – Spanish
  • Português – Portuguese
  • English – International
  • 日本語 – Japanese
Open Account
Client Portal
Daily Technical, Indices

VIX: Equity Volatility Remains Subdued Despite Cross-Asset Turbulence

February 3, 2026 Marco Turatti

While volatility across multiple asset classes has increased steadily over recent weeks—something we have all observed—the VIX index, which reflects equity market volatility and more specifically options on the S&P 500 maturing within 30 days, has remained relatively subdued. To be fair, the VIX has attempted to rebound a couple of times over the past two weeks; however, upon reaching non-extreme levels around 20.50, it was aggressively sold and quickly pushed back down.

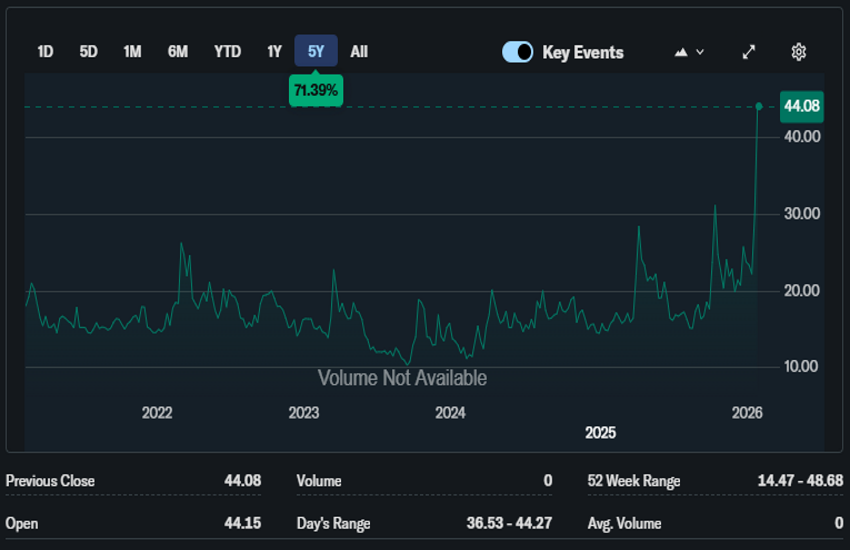
By contrast, the gold volatility index (GVZ) has surged recently from the 20 area to around 45, reaching a peak close of 46.02 on January 29. This represents a level not seen in at least five years, according to the data shown in the chart below. Over the same period, the U.S. Dollar Index has experienced a marked increase in daily trading ranges, expanding from roughly 40 cents to more than 80 cents per session over the past ten days, driven by the sharp sell-off in late January followed by the rebound seen over the last four sessions.

Gold Volatility Index, 5 Years

Meanwhile, the February VIX contract (which is a future and rolls on the third Tuesday of each month) continues to trade within a relatively tight range between 17.80 and 20.50. The week started poorly for equity markets yesterday morning, with sharp declines; however, a strong U.S. PMI release—beating expectations across the board, from new orders to labor market conditions, and most notably showing an unexpected return of manufacturing activity into expansionary territory—triggered a nearly 2% intraday rally from the lows in U.S. equity indices, with a comparable performance across European markets. As equities rise, volatility is typically sold, reflecting reduced demand for downside protection.

TECHNICAL ANALYSIS

We present a weekly chart for clarity of visualization. The zones we have highlighted represent areas of accumulation and distribution which, at least over the past year, have also helped identify equity market bottoms. The 16.00–16.50 area (green rectangle) can be considered a low-volatility zone; in recent months, the VIX has rarely traded below this range, making it a reasonably reliable accumulation and buying area for the instrument.

Conversely, the 22.50–23.40 zone (red rectangle) has consistently acted as a strong rejection area—attractive for selling VIX—and has historically coincided with equity market bottoms on the S&P 500. The last two candles that tested this zone in October and November of last year correspond to the two sessions that sharply pushed the S&P 500 down to 6,550 (it is currently trading around 6,997). Over the past few years, this area has only been decisively breached twice, most recently during the initial tariff announcement; therefore, when such a breakout occurs, it warrants close attention.

VIX, Weekly, 2024 – Now

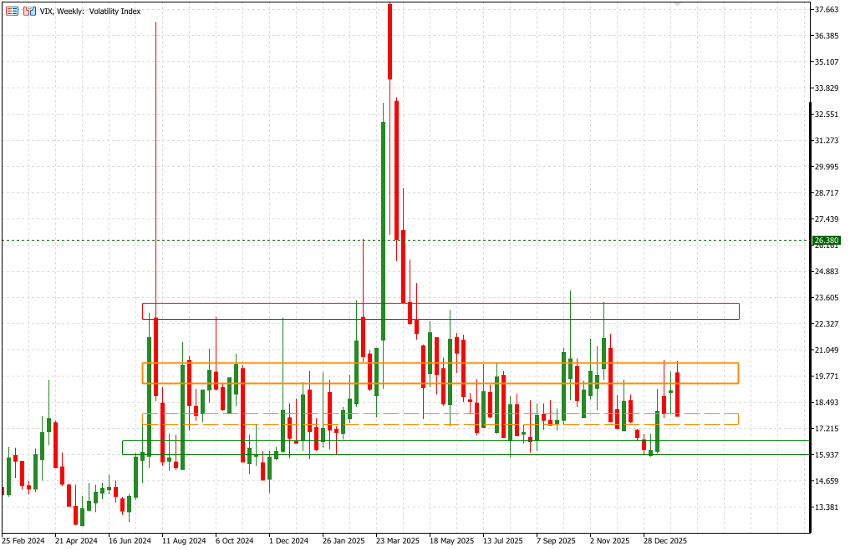
What we are observing in recent sessions, with the 19.50–20.50 range (orange rectangle) capping price action, represents a transitional zone and a state of indecision. However, a key observation is that when this consolidation forms after a move up from lower levels—specifically from the 16 area—it has historically preceded a genuine volatility spike a few weeks later. This was the case in January–February of last year and again in October.

On a daily timeframe, we are monitoring the current contract’s downside levels at 17.65, followed by 17.35, and potentially a full gap closure from the rollover at 16.70. Such a move would clearly imply new highs in equity indices, should it materialize. For reference, the March 2026 VIX contract is currently trading around 19.10.

  • Gold
  • PMI
  • VIX
  • Volatility

Post navigation

Previous

Search

Categories

  • Analysis (296)
  • Beginner (39)
  • Commodities (12)
  • Cryptos (170)
  • Currencies (223)
  • Daily Market Watch (75)
  • Daily Technical (210)
  • Education (87)
  • Expert (28)
  • Indices (6)
  • Intermediate (20)
  • Markets (522)
  • News & Releases (27)
  • Stocks (338)
  • Uncategorized (1)
  • Weekly Outlook (93)

Recent posts

  • VIX: Equity Volatility Remains Subdued Despite Cross-Asset Turbulence
  • RBA Signals February Rate Hike as Inflation Pressures Intensify
  • Weekly Market Outlook | 2 – 6 February 2026

Tags

Analysis Bitcoin company news Crypto Cryptocurrencies Currencies daily market watch Dollar ECB Education ETF ETFs Ethereum Euro Fed FX GBPUSD Gold Index inflation Japan Market market commentary Markets Nasdaq oil Outlook Pound Ripple SEC Silver Solana Stock Market Stocks Stocks Market Stocks today Technical Technical Analysis Trading Wall Street Weekly Weekly Outlook XAGUSD Yen Yuan

Related posts

Commodities, Daily Technical

Commodities Extend Melt-Up; Gold Targets the $5,000 Level

January 23, 2026 Marco Turatti

It has been a few days since we last discussed one of the hottest topics in the market and on everyone’s lips: the relentlessly rising price of gold. Yesterday, gold closed up 3.79%, reaching USD 4,959. Gold is not the only commodity whose price chart is taking on a parabolic or near-vertical shape. In recent […]

Commodities, Markets

Gold Prices Slide Below $4,800 After Trump Eases European Tariff Threat

January 22, 2026 Ari Ganesa

Gold prices dipped below the $4,800 per ounce level during early Asian trading on Thursday after U.S. President Donald Trump pulled back from previously threatening tariffs on European countries tied to his controversial Greenland strategy. This shift in rhetoric eased some geopolitical fears and reduced immediate safe-haven demand for bullion. Why Gold Is Pulling Back […]

Commodities, Daily Technical

Gold and Silver Surge Toward New All-Time Highs

December 23, 2025 Marco Turatti

In recent weeks we have discussed both metals, not only in light of the strong performance delivered over the past couple of years—particularly throughout 2025—but also because of their growing popularity among retail investors, especially gold. Regarding XAU, we were not expecting outsized further appreciation. We analyzed it when it was trading around $4,050; after […]

  • Privacy policy
  • Client agreement
  • Legal
  • Support
  • Privacy policy
  • Client agreement
  • Legal
  • Support
  • +2484671965
  • [email protected]
  • Chat with us
Company
  • About us
  • Regulation
  • Safety of funds
  • Company News
  • News & insights
  • FAQ
Account options
  • Standard accounts
  • Institutional Account
  • PAMM accounts
  • Swap-free account
Conditions
  • Spreads overview
  • Leverage tiers
  • CFD specifications
  • Markets coverage
Trading tools
  • MetaTrader 5
  • MetaTrader 4
  • Equinix trading server
  • Economic calendar
  • Daily technical
  • Weekly outlook
  • Market commentary
OnEquity Ltd is incorporated in Seychelles as a Securities Dealer with License No. SD154, authorized by the Seychelles Financial Services Authority (FSA), adhering to the Consolidated Securities Act, 2007. Registration No. 810588-1.

The website is operated and provides content by the OnEquity group of companies, which include:

OnEquity (MU) Ltd is regulated by the Financial Services Commission (FSC) Mauritius as an Investment Dealer (Full Service Dealer, excluding Underwriting) with License Number GB23201814.

OnEquity SA (Pty) Ltd, incorporated in South Africa, Company reg. 2021/321834/07, regulated by the Financial Sector Conduct Authority (FSCA) with FSP No. 53187.

ONEQ Global Ltd, registered in Cyprus, Company reg. HE 435383, located at Agias Zonis 22, Limassol, focusing on comprehensive service solutions within the OnEquity Group.
Risk Disclosure: Trading in financial instruments involves substantial risk and may not be suitable for all investors. The value of investments is volatile and can result in total loss of capital. Investors should consider their financial situation, investment experience, and risk tolerance, and may seek professional advice. Past performance is not indicative of future results.

Eligibility: Services are available to individuals 18 years or older.

OnEquity (MU) Ltd, licensed by the Financial Services Commission (FSC) of Mauritius, is not authorized to offer Contracts for Difference (CFDs) on cryptocurrencies. Clients wishing to trade cryptocurrency products must apply to be registered under OnEquity Ltd (Seychelles) that is duly authorized to offer such instruments.

Please note that Copy Trading services are not available to clients trading under the OnEquity (MU) Ltd license.

Restricted Jurisdictions: The content provided by OnEquity is not intended for residents of the United States, Canada, North Korea, Myanmar, Iran, Yemen, Syria, Yemen, Sudan, Russia and/or any jurisdiction where such distribution or use would be contrary to international or local law or regulation.

All trademarks™ and brand names belong to their respective owners and are used here for identification purposes only. Use of these names does not imply endorsement.

© OnEquity. All Rights Reserved.