VIX Retreats After Volatility Surge

Amid recent geopolitical developments, futures on the implied volatility of the S&P 500—the VIX—rose to touch the 30 level on Monday, March 9, a level last seen in April 2025. In a recent note published by a professional volatility trader, it was argued that when the VIX closes above 30, opportunities for volatility traders tend to expand significantly.
Above those levels, Volatility Control Funds become more active, the activity of Relative Value Traders who trade the shape of the curve intensifies, and more generally the various institutional desks begin to sell contracts aggressively given the high implied premium. He finished by saying—with the very typical tone of an institutional trader—that above 30 (implicitly meaning by selling) you could “make your year” (reach your annual profit target) in a few months; above 40, if you’re good enough, you can really make a few years’ worth of P&L. Above 50, you can change your career—obviously for the better.

On Monday morning, the VIX briefly reached the 30 level. As of now, the VIX has dropped back down to 24.65, and it did so rather violently for an instrument that tends to rise quickly and forcefully but fall slowly and relentlessly. The spike we are discussing had another rather unusual effect: it inverted the futures curve, pushing it into backwardation (front-end contracts are more expensive than those deliverable further out in time), whereas the normal state is for the VIX curve to be positively sloped.
This happens for several reasons: the mean-reverting nature of the instrument, which tends to move back toward a long-term average (between 17 and 20 in recent years) and which, under normal market conditions, trades below that average; or the premium demanded for long-term uncertainty. In any case, the current situation on the curve is anomalous.
Technical Analysis
Let’s start with the long-term daily chart, where we have highlighted the levels we discussed and others: 30 and 40—the latter being the maximum zone reached during the big shock almost a year ago linked to tariffs. On the other side, 15.90 / 16 has proven to be an excellent area to buy.
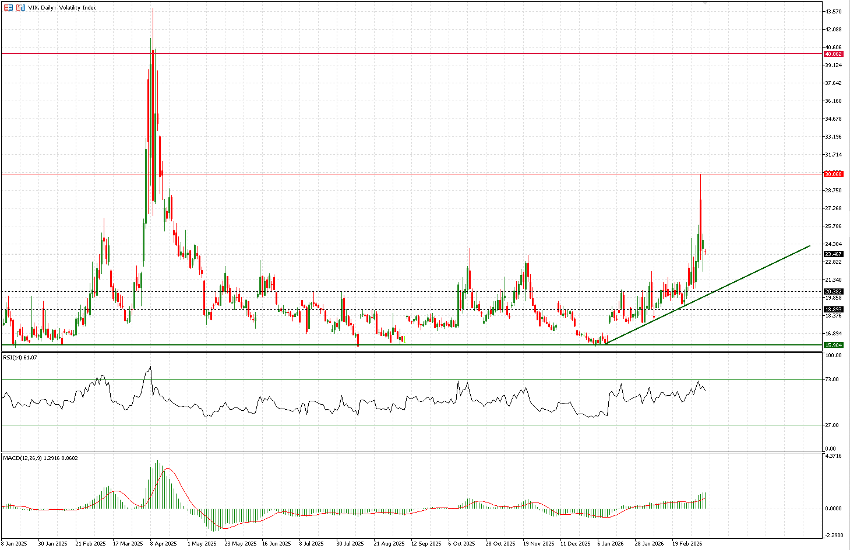
Finally, there are important technical levels such as 20 and 23.45, the latter being roughly where the VIX is trading right now (23.67 at the time of writing). Will the test of 30 be enough to push the VIX decisively lower again? At the moment we doubt it. The situation is still too tense and risks structurally changing the energy market for a moderately long period of time, with consequences for inflation and so on; meanwhile, U.S. indices are still only a few steps away from their all-time highs.
From a technical analysis perspective, we could say there might still be some room to the downside, at least to test the green trendline that has been pushing prices higher this year. As of today, it passes around 20. Another trendline has been forming since the end of February and has already been tested several times (March 4–5, March 10): today it lies around 22.30, and we think this area could provide fairly strong support and attract bids.

To the upside we are monitoring 24.80, 25.90, and 27.40. Although the VIX tends to decline slowly after a spike, we suspect that this spike will be retested at least once. In any case, stick to the technical levels, and don’t forget that the current futures contract—Mar26—expires in six days, on March 17.