Large-Cap Growth Stocks Near New Highs (AMD)

Last session, the Nikkei (cash) reached new all-time highs, advancing +2.38%. It joins the FTSE MIB in Europe and the S&P 500 in the U.S. among major indices that have fully absorbed recent market concerns.
Over the past week, Consumer stocks—where AMZN, GOOGL, and META carry significant weight—led the rally with a +6.64% gain, followed by Technology stocks, up +6.08%. Growth stocks, typically high-beta names with higher earnings sensitivity than Value, have outperformed, as reflected by the IWF ETF, which gained +5.35% over the last five sessions.
Earnings season has also commenced with major U.S. banks, with results broadly exceeding expectations, including JPMorgan and Citigroup.
From a positioning perspective, part of the move can be attributed to systematic flows. Market participants remain relatively underexposed on the long side, while options-related hedging activity continues to support equity demand. These dynamics are increasingly visible at the single-stock level, including in AMD.
TECHNICAL ANALYSIS
AMD (Advanced Micro Devices), founded in 1969, is a global semiconductor company designing high-performance CPUs and GPUs. It competes with Intel in processors and with NVIDIA in graphics and AI accelerators. While NVIDIA maintains leadership in AI chips, AMD continues to expand its positioning through EPYC server processors and Instinct GPU accelerators, strengthening its role in data center and AI infrastructure.
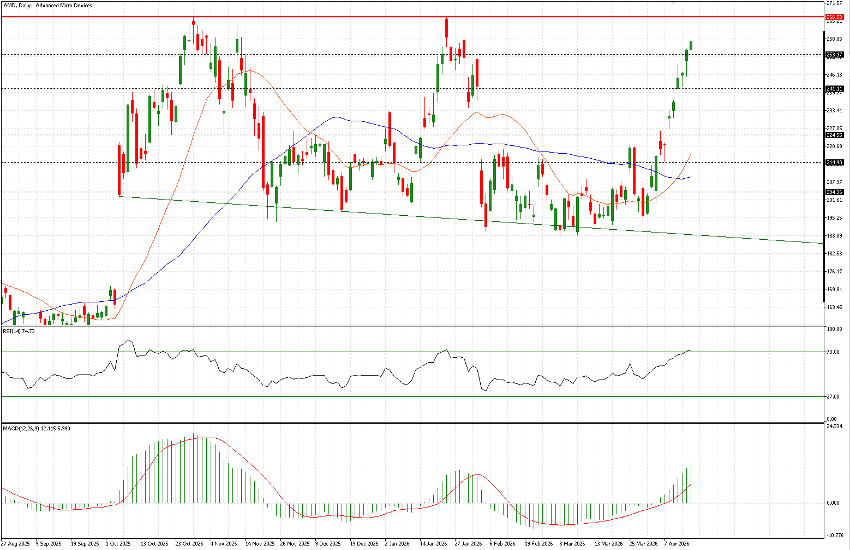
From the March 30 low ($208.43) to the most recent close ($258.12), AMD has advanced +33.83% over 11 sessions. Price has returned to the upper boundary of a broad trading range, slightly downward sloping, which formed following the gap-up after the OpenAI collaboration announcement on October 6, 2025.
Price action remains irregular, characterized by multiple gaps and extended wicks. In this context, static levels provide clearer structure. Key levels are identified at $253, $241, $225, $215, and $204. The primary resistance stands at $266.50, currently defining a potential double top and acting as the near-term target.
Indicators offer limited confirmation at this stage. The RSI is approaching overbought territory, while the distance from the 21-day and 50-day moving averages has widened, indicating stretched conditions.
In summary, momentum remains strong, but positioning is increasingly extended, requiring careful risk management at current levels.
